Immigrants from Sweden vs Shoshone Married-couple Households
COMPARE
Immigrants from Sweden
Shoshone
Married-couple Households
Married-couple Households Comparison
Immigrants from Sweden
Shoshone
47.2%
MARRIED-COUPLE HOUSEHOLDS
84.7/ 100
METRIC RATING
139th/ 347
METRIC RANK
43.9%
MARRIED-COUPLE HOUSEHOLDS
0.3/ 100
METRIC RATING
255th/ 347
METRIC RANK
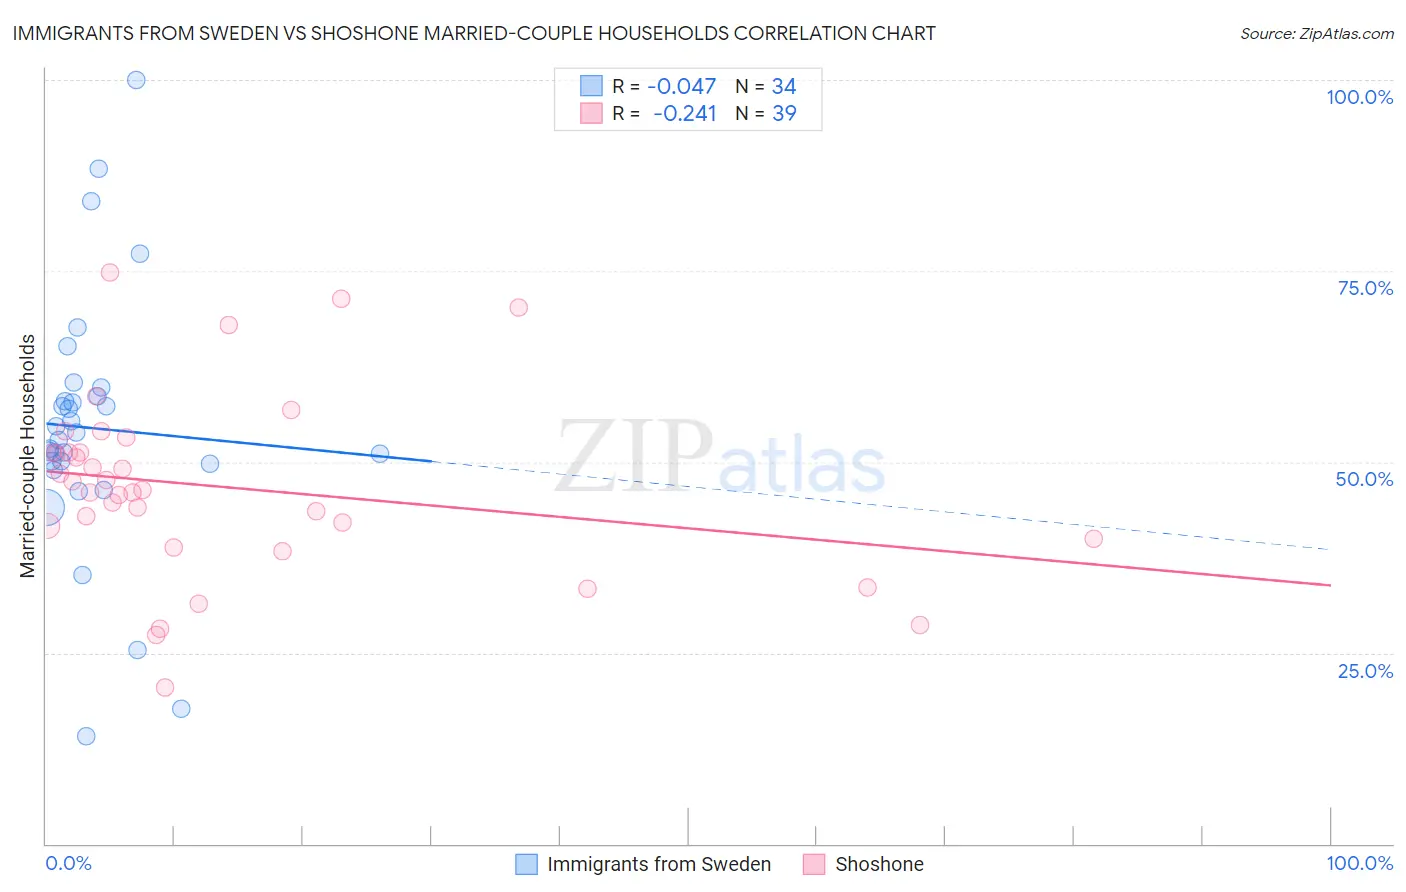
Immigrants from Sweden vs Shoshone Married-couple Households Correlation Chart
The statistical analysis conducted on geographies consisting of 164,705,416 people shows no correlation between the proportion of Immigrants from Sweden and percentage of married-couple family households in the United States with a correlation coefficient (R) of -0.047 and weighted average of 47.2%. Similarly, the statistical analysis conducted on geographies consisting of 66,615,808 people shows a weak negative correlation between the proportion of Shoshone and percentage of married-couple family households in the United States with a correlation coefficient (R) of -0.241 and weighted average of 43.9%, a difference of 7.5%.
Married-couple Households Correlation Summary
| Measurement | Immigrants from Sweden | Shoshone |
| Minimum | 14.1% | 20.5% |
| Maximum | 100.0% | 74.8% |
| Range | 85.9% | 54.3% |
| Mean | 54.4% | 46.7% |
| Median | 53.4% | 46.4% |
| Interquartile 25% (IQ1) | 49.7% | 40.0% |
| Interquartile 75% (IQ3) | 58.6% | 51.3% |
| Interquartile Range (IQR) | 8.9% | 11.3% |
| Standard Deviation (Sample) | 17.1% | 12.0% |
| Standard Deviation (Population) | 16.8% | 11.9% |
Similar Demographics by Married-couple Households
Demographics Similar to Immigrants from Sweden by Married-couple Households
In terms of married-couple households, the demographic groups most similar to Immigrants from Sweden are Spanish (47.2%, a difference of 0.020%), Costa Rican (47.2%, a difference of 0.020%), Immigrants from Afghanistan (47.2%, a difference of 0.030%), New Zealander (47.2%, a difference of 0.040%), and Immigrants from Malaysia (47.2%, a difference of 0.040%).
| Demographics | Rating | Rank | Married-couple Households |
| Immigrants | Ukraine | 86.7 /100 | #132 | Excellent 47.3% |
| South Africans | 86.4 /100 | #133 | Excellent 47.3% |
| Immigrants | Greece | 86.0 /100 | #134 | Excellent 47.2% |
| Immigrants | Argentina | 86.0 /100 | #135 | Excellent 47.2% |
| New Zealanders | 85.3 /100 | #136 | Excellent 47.2% |
| Immigrants | Malaysia | 85.2 /100 | #137 | Excellent 47.2% |
| Immigrants | Afghanistan | 85.1 /100 | #138 | Excellent 47.2% |
| Immigrants | Sweden | 84.7 /100 | #139 | Excellent 47.2% |
| Spanish | 84.5 /100 | #140 | Excellent 47.2% |
| Costa Ricans | 84.4 /100 | #141 | Excellent 47.2% |
| Spaniards | 84.1 /100 | #142 | Excellent 47.2% |
| Immigrants | Belarus | 83.8 /100 | #143 | Excellent 47.2% |
| Mexicans | 83.4 /100 | #144 | Excellent 47.1% |
| Slovenes | 81.7 /100 | #145 | Excellent 47.1% |
| Immigrants | Western Europe | 81.6 /100 | #146 | Excellent 47.1% |
Demographics Similar to Shoshone by Married-couple Households
In terms of married-couple households, the demographic groups most similar to Shoshone are Apache (43.9%, a difference of 0.020%), Central American (43.9%, a difference of 0.070%), Ugandan (43.8%, a difference of 0.14%), Seminole (44.0%, a difference of 0.19%), and German Russian (44.0%, a difference of 0.26%).
| Demographics | Rating | Rank | Married-couple Households |
| Yup'ik | 0.4 /100 | #248 | Tragic 44.1% |
| Immigrants | Kenya | 0.4 /100 | #249 | Tragic 44.1% |
| French American Indians | 0.4 /100 | #250 | Tragic 44.1% |
| German Russians | 0.4 /100 | #251 | Tragic 44.0% |
| Seminole | 0.4 /100 | #252 | Tragic 44.0% |
| Central Americans | 0.3 /100 | #253 | Tragic 43.9% |
| Apache | 0.3 /100 | #254 | Tragic 43.9% |
| Shoshone | 0.3 /100 | #255 | Tragic 43.9% |
| Ugandans | 0.3 /100 | #256 | Tragic 43.8% |
| Blackfeet | 0.2 /100 | #257 | Tragic 43.8% |
| Central American Indians | 0.2 /100 | #258 | Tragic 43.8% |
| Iroquois | 0.2 /100 | #259 | Tragic 43.7% |
| Immigrants | Cameroon | 0.2 /100 | #260 | Tragic 43.7% |
| Alaskan Athabascans | 0.2 /100 | #261 | Tragic 43.6% |
| Vietnamese | 0.2 /100 | #262 | Tragic 43.6% |