Immigrants from Turkey vs Shoshone Married-couple Households
COMPARE
Immigrants from Turkey
Shoshone
Married-couple Households
Married-couple Households Comparison
Immigrants from Turkey
Shoshone
46.8%
MARRIED-COUPLE HOUSEHOLDS
70.2/ 100
METRIC RATING
163rd/ 347
METRIC RANK
43.9%
MARRIED-COUPLE HOUSEHOLDS
0.3/ 100
METRIC RATING
255th/ 347
METRIC RANK
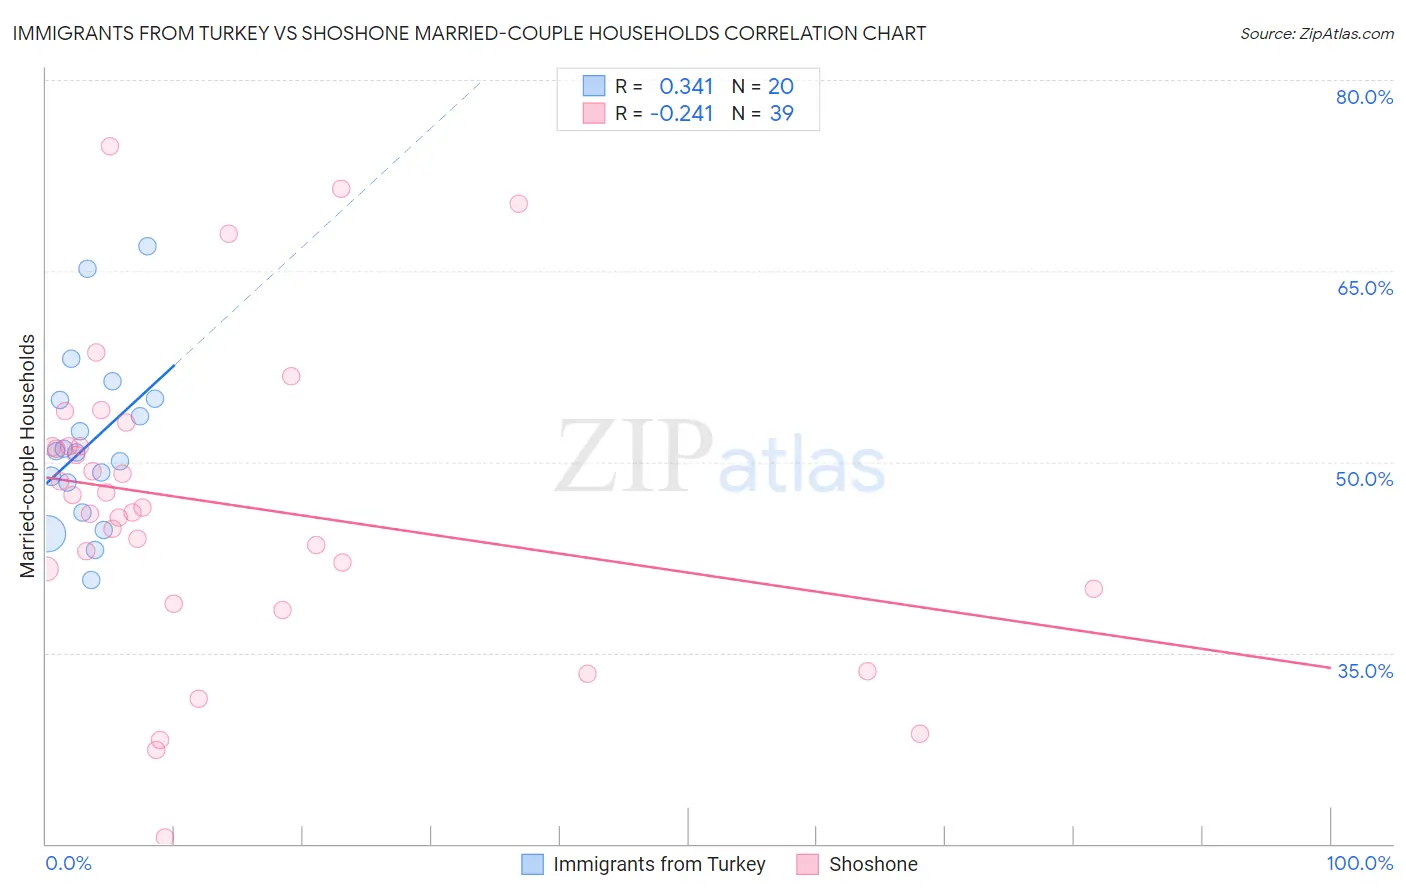
Immigrants from Turkey vs Shoshone Married-couple Households Correlation Chart
The statistical analysis conducted on geographies consisting of 222,970,695 people shows a mild positive correlation between the proportion of Immigrants from Turkey and percentage of married-couple family households in the United States with a correlation coefficient (R) of 0.341 and weighted average of 46.8%. Similarly, the statistical analysis conducted on geographies consisting of 66,615,808 people shows a weak negative correlation between the proportion of Shoshone and percentage of married-couple family households in the United States with a correlation coefficient (R) of -0.241 and weighted average of 43.9%, a difference of 6.6%.
Married-couple Households Correlation Summary
| Measurement | Immigrants from Turkey | Shoshone |
| Minimum | 40.7% | 20.5% |
| Maximum | 67.0% | 74.8% |
| Range | 26.2% | 54.3% |
| Mean | 51.5% | 46.7% |
| Median | 50.8% | 46.4% |
| Interquartile 25% (IQ1) | 47.2% | 40.0% |
| Interquartile 75% (IQ3) | 54.9% | 51.3% |
| Interquartile Range (IQR) | 7.7% | 11.3% |
| Standard Deviation (Sample) | 6.7% | 12.0% |
| Standard Deviation (Population) | 6.6% | 11.9% |
Similar Demographics by Married-couple Households
Demographics Similar to Immigrants from Turkey by Married-couple Households
In terms of married-couple households, the demographic groups most similar to Immigrants from Turkey are Immigrants from Kazakhstan (46.8%, a difference of 0.010%), Immigrants from Southern Europe (46.8%, a difference of 0.010%), Delaware (46.8%, a difference of 0.040%), Colombian (46.8%, a difference of 0.040%), and Iraqi (46.9%, a difference of 0.070%).
| Demographics | Rating | Rank | Married-couple Households |
| Armenians | 75.4 /100 | #156 | Good 46.9% |
| Immigrants | Oceania | 74.8 /100 | #157 | Good 46.9% |
| Immigrants | Nonimmigrants | 73.3 /100 | #158 | Good 46.9% |
| Osage | 73.2 /100 | #159 | Good 46.9% |
| Iraqis | 71.7 /100 | #160 | Good 46.9% |
| Delaware | 71.2 /100 | #161 | Good 46.8% |
| Colombians | 71.0 /100 | #162 | Good 46.8% |
| Immigrants | Turkey | 70.2 /100 | #163 | Good 46.8% |
| Immigrants | Kazakhstan | 70.0 /100 | #164 | Good 46.8% |
| Immigrants | Southern Europe | 69.9 /100 | #165 | Good 46.8% |
| Cherokee | 65.7 /100 | #166 | Good 46.7% |
| Immigrants | Croatia | 64.2 /100 | #167 | Good 46.7% |
| Israelis | 62.3 /100 | #168 | Good 46.7% |
| Spanish American Indians | 59.4 /100 | #169 | Average 46.6% |
| South Americans | 58.0 /100 | #170 | Average 46.6% |
Demographics Similar to Shoshone by Married-couple Households
In terms of married-couple households, the demographic groups most similar to Shoshone are Apache (43.9%, a difference of 0.020%), Central American (43.9%, a difference of 0.070%), Ugandan (43.8%, a difference of 0.14%), Seminole (44.0%, a difference of 0.19%), and German Russian (44.0%, a difference of 0.26%).
| Demographics | Rating | Rank | Married-couple Households |
| Yup'ik | 0.4 /100 | #248 | Tragic 44.1% |
| Immigrants | Kenya | 0.4 /100 | #249 | Tragic 44.1% |
| French American Indians | 0.4 /100 | #250 | Tragic 44.1% |
| German Russians | 0.4 /100 | #251 | Tragic 44.0% |
| Seminole | 0.4 /100 | #252 | Tragic 44.0% |
| Central Americans | 0.3 /100 | #253 | Tragic 43.9% |
| Apache | 0.3 /100 | #254 | Tragic 43.9% |
| Shoshone | 0.3 /100 | #255 | Tragic 43.9% |
| Ugandans | 0.3 /100 | #256 | Tragic 43.8% |
| Blackfeet | 0.2 /100 | #257 | Tragic 43.8% |
| Central American Indians | 0.2 /100 | #258 | Tragic 43.8% |
| Iroquois | 0.2 /100 | #259 | Tragic 43.7% |
| Immigrants | Cameroon | 0.2 /100 | #260 | Tragic 43.7% |
| Alaskan Athabascans | 0.2 /100 | #261 | Tragic 43.6% |
| Vietnamese | 0.2 /100 | #262 | Tragic 43.6% |