Immigrants from Southern Europe vs Immigrants from Scotland Family Households
COMPARE
Immigrants from Southern Europe
Immigrants from Scotland
Family Households
Family Households Comparison
Immigrants from Southern Europe
Immigrants from Scotland
64.4%
FAMILY HOUSEHOLDS
60.0/ 100
METRIC RATING
165th/ 347
METRIC RANK
64.7%
FAMILY HOUSEHOLDS
86.4/ 100
METRIC RATING
137th/ 347
METRIC RANK
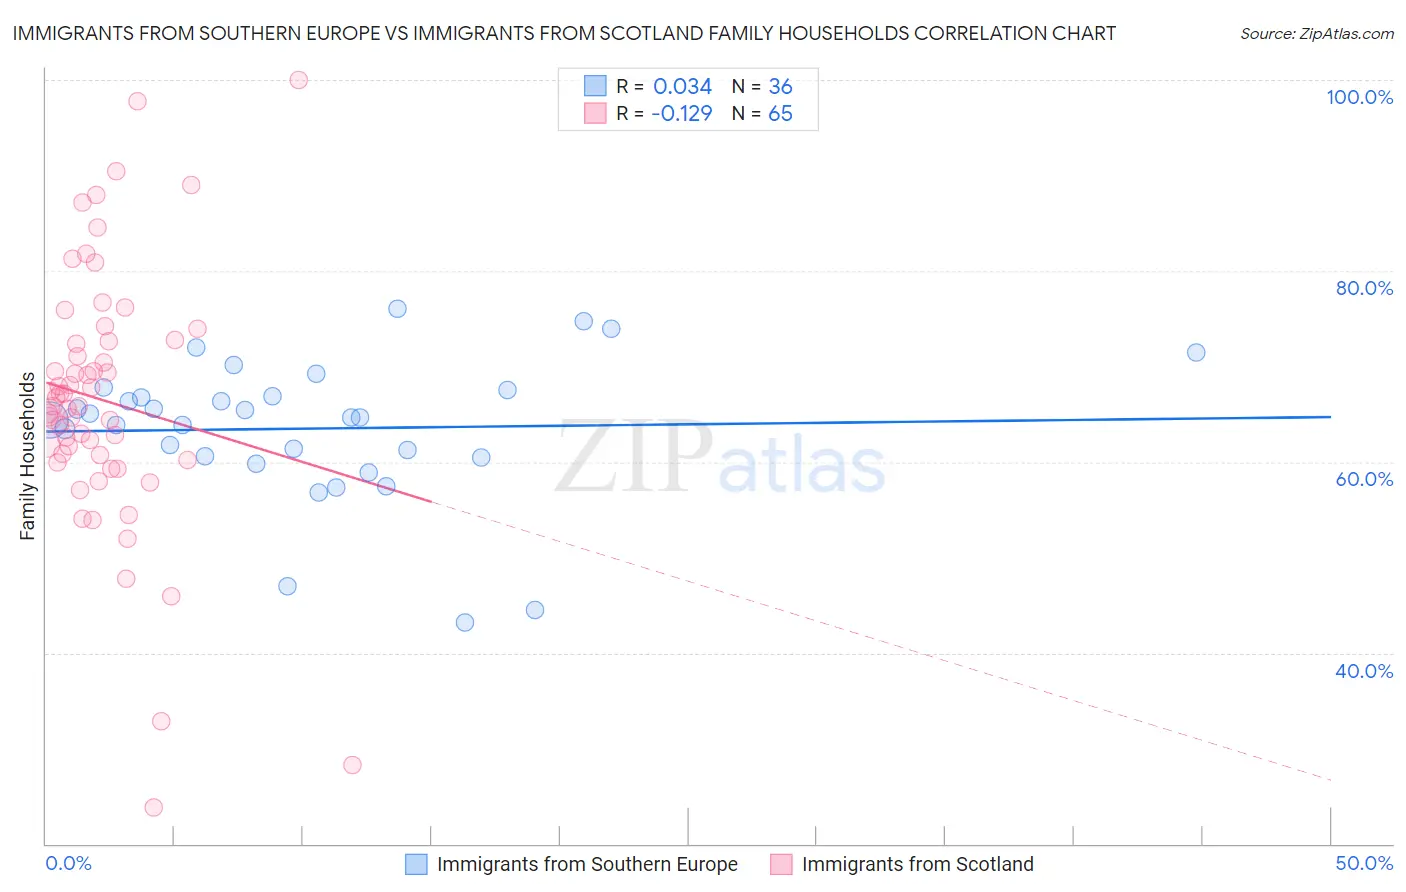
Immigrants from Southern Europe vs Immigrants from Scotland Family Households Correlation Chart
The statistical analysis conducted on geographies consisting of 402,628,805 people shows no correlation between the proportion of Immigrants from Southern Europe and percentage of family households in the United States with a correlation coefficient (R) of 0.034 and weighted average of 64.4%. Similarly, the statistical analysis conducted on geographies consisting of 196,383,501 people shows a poor negative correlation between the proportion of Immigrants from Scotland and percentage of family households in the United States with a correlation coefficient (R) of -0.129 and weighted average of 64.7%, a difference of 0.48%.
Family Households Correlation Summary
| Measurement | Immigrants from Southern Europe | Immigrants from Scotland |
| Minimum | 43.1% | 23.8% |
| Maximum | 76.0% | 100.0% |
| Range | 32.9% | 76.2% |
| Mean | 63.5% | 66.5% |
| Median | 64.7% | 65.8% |
| Interquartile 25% (IQ1) | 60.5% | 60.5% |
| Interquartile 75% (IQ3) | 67.2% | 72.7% |
| Interquartile Range (IQR) | 6.7% | 12.2% |
| Standard Deviation (Sample) | 7.4% | 13.8% |
| Standard Deviation (Population) | 7.3% | 13.7% |
Similar Demographics by Family Households
Demographics Similar to Immigrants from Southern Europe by Family Households
In terms of family households, the demographic groups most similar to Immigrants from Southern Europe are Immigrants from Nigeria (64.4%, a difference of 0.0%), Scotch-Irish (64.4%, a difference of 0.010%), British (64.4%, a difference of 0.020%), Chickasaw (64.4%, a difference of 0.020%), and Irish (64.4%, a difference of 0.030%).
| Demographics | Rating | Rank | Family Households |
| Lebanese | 66.4 /100 | #158 | Good 64.4% |
| Germans | 65.8 /100 | #159 | Good 64.4% |
| Immigrants | Moldova | 65.2 /100 | #160 | Good 64.4% |
| Immigrants | England | 62.6 /100 | #161 | Good 64.4% |
| British | 61.6 /100 | #162 | Good 64.4% |
| Chickasaw | 61.5 /100 | #163 | Good 64.4% |
| Immigrants | Nigeria | 60.1 /100 | #164 | Good 64.4% |
| Immigrants | Southern Europe | 60.0 /100 | #165 | Good 64.4% |
| Scotch-Irish | 59.2 /100 | #166 | Average 64.4% |
| Irish | 57.9 /100 | #167 | Average 64.4% |
| Hondurans | 57.5 /100 | #168 | Average 64.4% |
| Iraqis | 56.0 /100 | #169 | Average 64.4% |
| Armenians | 55.9 /100 | #170 | Average 64.4% |
| Ute | 54.6 /100 | #171 | Average 64.3% |
| Dutch West Indians | 53.9 /100 | #172 | Average 64.3% |
Demographics Similar to Immigrants from Scotland by Family Households
In terms of family households, the demographic groups most similar to Immigrants from Scotland are Immigrants from China (64.7%, a difference of 0.010%), Basque (64.7%, a difference of 0.020%), Maltese (64.7%, a difference of 0.030%), Immigrants from Jamaica (64.7%, a difference of 0.030%), and Immigrants from North Macedonia (64.7%, a difference of 0.040%).
| Demographics | Rating | Rank | Family Households |
| Immigrants | Italy | 90.2 /100 | #130 | Exceptional 64.8% |
| Immigrants | Nonimmigrants | 90.1 /100 | #131 | Exceptional 64.8% |
| Cajuns | 89.4 /100 | #132 | Excellent 64.8% |
| Belizeans | 89.3 /100 | #133 | Excellent 64.8% |
| Greeks | 88.1 /100 | #134 | Excellent 64.7% |
| Maltese | 87.4 /100 | #135 | Excellent 64.7% |
| Immigrants | China | 86.6 /100 | #136 | Excellent 64.7% |
| Immigrants | Scotland | 86.4 /100 | #137 | Excellent 64.7% |
| Basques | 85.5 /100 | #138 | Excellent 64.7% |
| Immigrants | Jamaica | 85.3 /100 | #139 | Excellent 64.7% |
| Immigrants | North Macedonia | 84.9 /100 | #140 | Excellent 64.7% |
| Immigrants | Cameroon | 84.8 /100 | #141 | Excellent 64.7% |
| Pakistanis | 84.0 /100 | #142 | Excellent 64.7% |
| Czechoslovakians | 82.1 /100 | #143 | Excellent 64.6% |
| South American Indians | 81.9 /100 | #144 | Excellent 64.6% |