Immigrants from Serbia vs Immigrants from Czechoslovakia Family Households
COMPARE
Immigrants from Serbia
Immigrants from Czechoslovakia
Family Households
Family Households Comparison
Immigrants from Serbia
Immigrants from Czechoslovakia
61.6%
FAMILY HOUSEHOLDS
0.0/ 100
METRIC RATING
322nd/ 347
METRIC RANK
63.4%
FAMILY HOUSEHOLDS
1.8/ 100
METRIC RATING
243rd/ 347
METRIC RANK
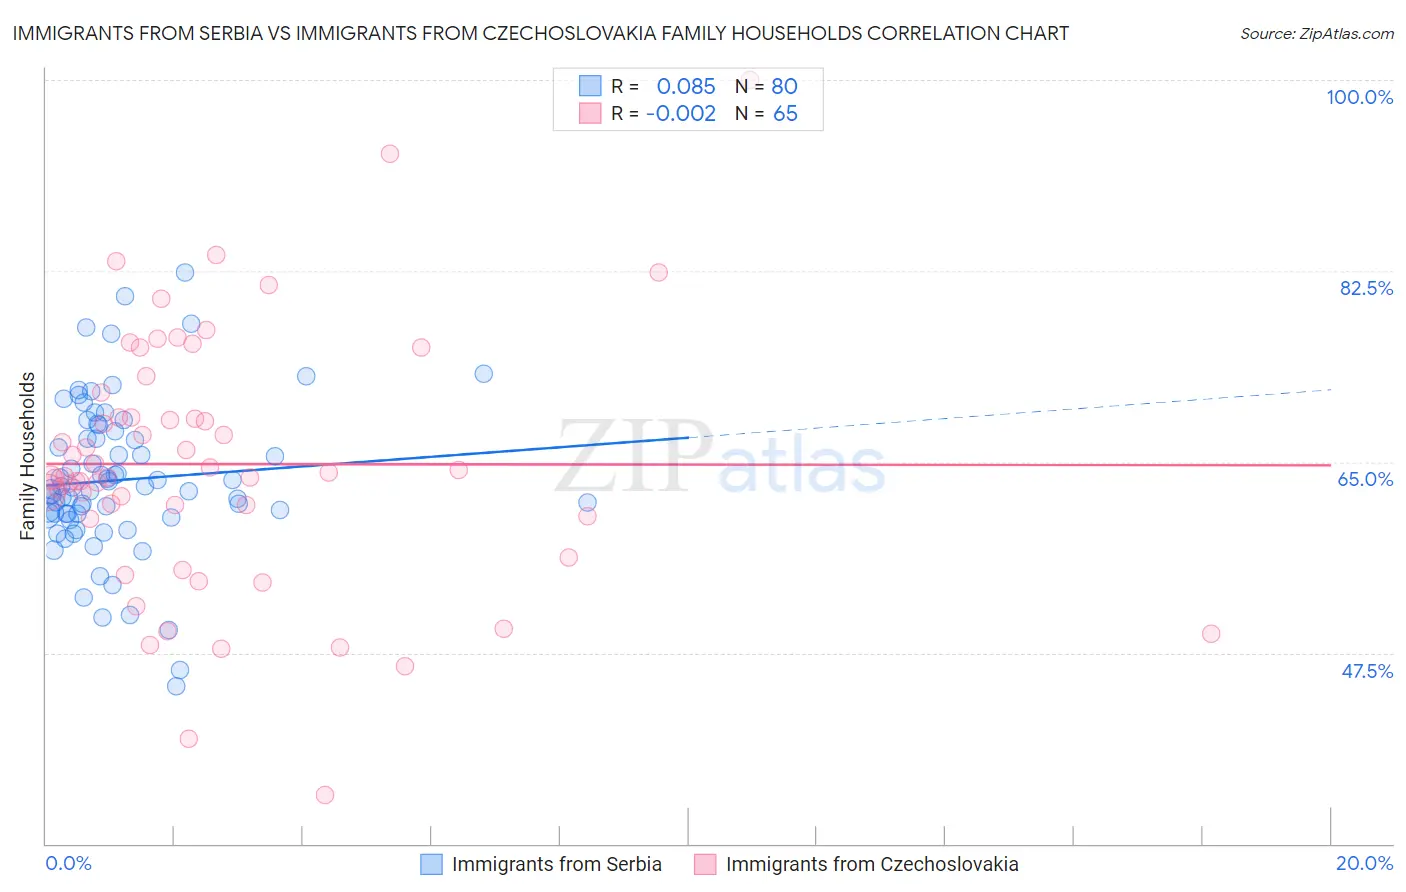
Immigrants from Serbia vs Immigrants from Czechoslovakia Family Households Correlation Chart
The statistical analysis conducted on geographies consisting of 131,724,151 people shows a slight positive correlation between the proportion of Immigrants from Serbia and percentage of family households in the United States with a correlation coefficient (R) of 0.085 and weighted average of 61.6%. Similarly, the statistical analysis conducted on geographies consisting of 195,445,494 people shows no correlation between the proportion of Immigrants from Czechoslovakia and percentage of family households in the United States with a correlation coefficient (R) of -0.002 and weighted average of 63.4%, a difference of 2.9%.
Family Households Correlation Summary
| Measurement | Immigrants from Serbia | Immigrants from Czechoslovakia |
| Minimum | 44.5% | 34.4% |
| Maximum | 82.3% | 100.0% |
| Range | 37.8% | 65.6% |
| Mean | 63.4% | 64.8% |
| Median | 62.6% | 63.7% |
| Interquartile 25% (IQ1) | 60.2% | 59.9% |
| Interquartile 75% (IQ3) | 67.5% | 70.2% |
| Interquartile Range (IQR) | 7.3% | 10.4% |
| Standard Deviation (Sample) | 7.0% | 11.8% |
| Standard Deviation (Population) | 7.0% | 11.7% |
Similar Demographics by Family Households
Demographics Similar to Immigrants from Serbia by Family Households
In terms of family households, the demographic groups most similar to Immigrants from Serbia are Tlingit-Haida (61.6%, a difference of 0.010%), Immigrants from West Indies (61.6%, a difference of 0.010%), Immigrants from Switzerland (61.6%, a difference of 0.020%), Alsatian (61.7%, a difference of 0.090%), and Ugandan (61.7%, a difference of 0.14%).
| Demographics | Rating | Rank | Family Households |
| Moroccans | 0.0 /100 | #315 | Tragic 61.9% |
| Immigrants | Middle Africa | 0.0 /100 | #316 | Tragic 61.9% |
| Immigrants | Bosnia and Herzegovina | 0.0 /100 | #317 | Tragic 61.9% |
| Alaskan Athabascans | 0.0 /100 | #318 | Tragic 61.8% |
| Cape Verdeans | 0.0 /100 | #319 | Tragic 61.8% |
| Ugandans | 0.0 /100 | #320 | Tragic 61.7% |
| Alsatians | 0.0 /100 | #321 | Tragic 61.7% |
| Immigrants | Serbia | 0.0 /100 | #322 | Tragic 61.6% |
| Tlingit-Haida | 0.0 /100 | #323 | Tragic 61.6% |
| Immigrants | West Indies | 0.0 /100 | #324 | Tragic 61.6% |
| Immigrants | Switzerland | 0.0 /100 | #325 | Tragic 61.6% |
| Indonesians | 0.0 /100 | #326 | Tragic 61.5% |
| Blacks/African Americans | 0.0 /100 | #327 | Tragic 61.5% |
| Kiowa | 0.0 /100 | #328 | Tragic 61.4% |
| Cambodians | 0.0 /100 | #329 | Tragic 61.4% |
Demographics Similar to Immigrants from Czechoslovakia by Family Households
In terms of family households, the demographic groups most similar to Immigrants from Czechoslovakia are Immigrants from Israel (63.4%, a difference of 0.010%), Immigrants from St. Vincent and the Grenadines (63.4%, a difference of 0.020%), Aleut (63.4%, a difference of 0.030%), South African (63.4%, a difference of 0.030%), and Eastern European (63.4%, a difference of 0.030%).
| Demographics | Rating | Rank | Family Households |
| Ghanaians | 2.1 /100 | #236 | Tragic 63.5% |
| Comanche | 2.1 /100 | #237 | Tragic 63.5% |
| Immigrants | Zimbabwe | 2.0 /100 | #238 | Tragic 63.5% |
| Aleuts | 1.9 /100 | #239 | Tragic 63.4% |
| South Africans | 1.9 /100 | #240 | Tragic 63.4% |
| Immigrants | St. Vincent and the Grenadines | 1.9 /100 | #241 | Tragic 63.4% |
| Immigrants | Israel | 1.8 /100 | #242 | Tragic 63.4% |
| Immigrants | Czechoslovakia | 1.8 /100 | #243 | Tragic 63.4% |
| Eastern Europeans | 1.6 /100 | #244 | Tragic 63.4% |
| Immigrants | Dominica | 1.6 /100 | #245 | Tragic 63.4% |
| Immigrants | Ghana | 1.6 /100 | #246 | Tragic 63.4% |
| Immigrants | Uzbekistan | 1.5 /100 | #247 | Tragic 63.4% |
| Dominicans | 1.5 /100 | #248 | Tragic 63.4% |
| Russians | 1.4 /100 | #249 | Tragic 63.4% |
| Immigrants | Japan | 1.4 /100 | #250 | Tragic 63.4% |