Immigrants from Nicaragua vs Immigrants from Jamaica Married-couple Households
COMPARE
Immigrants from Nicaragua
Immigrants from Jamaica
Married-couple Households
Married-couple Households Comparison
Immigrants from Nicaragua
Immigrants from Jamaica
44.5%
MARRIED-COUPLE HOUSEHOLDS
1.2/ 100
METRIC RATING
235th/ 347
METRIC RANK
40.7%
MARRIED-COUPLE HOUSEHOLDS
0.0/ 100
METRIC RATING
317th/ 347
METRIC RANK
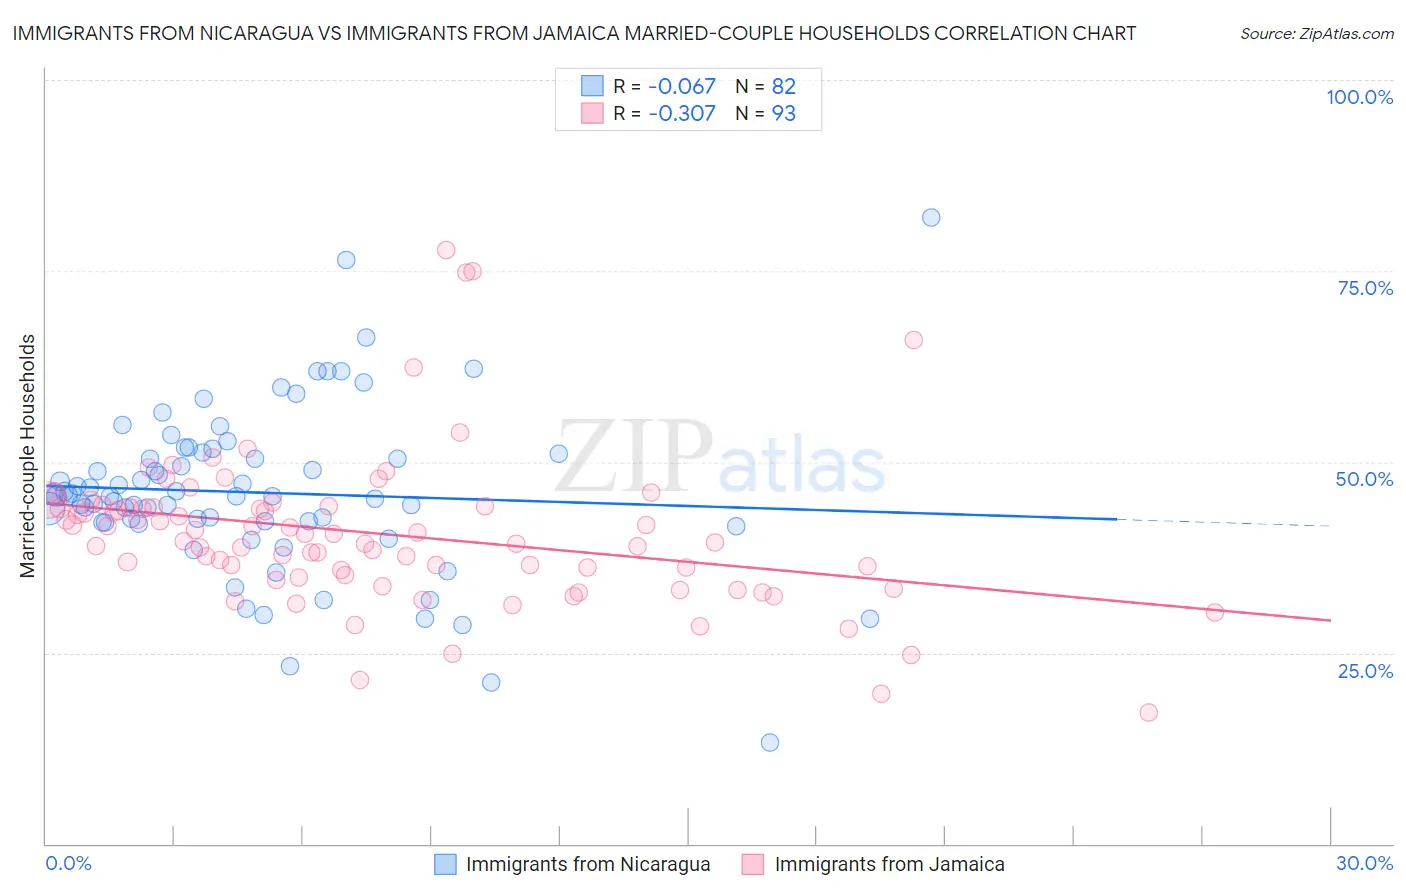
Immigrants from Nicaragua vs Immigrants from Jamaica Married-couple Households Correlation Chart
The statistical analysis conducted on geographies consisting of 236,322,720 people shows a slight negative correlation between the proportion of Immigrants from Nicaragua and percentage of married-couple family households in the United States with a correlation coefficient (R) of -0.067 and weighted average of 44.5%. Similarly, the statistical analysis conducted on geographies consisting of 301,578,290 people shows a mild negative correlation between the proportion of Immigrants from Jamaica and percentage of married-couple family households in the United States with a correlation coefficient (R) of -0.307 and weighted average of 40.7%, a difference of 9.5%.
Married-couple Households Correlation Summary
| Measurement | Immigrants from Nicaragua | Immigrants from Jamaica |
| Minimum | 13.2% | 17.2% |
| Maximum | 82.0% | 77.7% |
| Range | 68.8% | 60.5% |
| Mean | 46.0% | 40.6% |
| Median | 45.5% | 39.5% |
| Interquartile 25% (IQ1) | 42.1% | 35.0% |
| Interquartile 75% (IQ3) | 51.0% | 44.1% |
| Interquartile Range (IQR) | 9.0% | 9.1% |
| Standard Deviation (Sample) | 10.9% | 10.1% |
| Standard Deviation (Population) | 10.9% | 10.1% |
Similar Demographics by Married-couple Households
Demographics Similar to Immigrants from Nicaragua by Married-couple Households
In terms of married-couple households, the demographic groups most similar to Immigrants from Nicaragua are Yaqui (44.5%, a difference of 0.0%), Comanche (44.5%, a difference of 0.040%), Immigrants from Panama (44.6%, a difference of 0.070%), Immigrants from Uruguay (44.5%, a difference of 0.090%), and Spanish American (44.5%, a difference of 0.10%).
| Demographics | Rating | Rank | Married-couple Households |
| Kenyans | 1.7 /100 | #228 | Tragic 44.7% |
| Immigrants | Latin America | 1.6 /100 | #229 | Tragic 44.7% |
| Soviet Union | 1.6 /100 | #230 | Tragic 44.6% |
| Houma | 1.5 /100 | #231 | Tragic 44.6% |
| Marshallese | 1.5 /100 | #232 | Tragic 44.6% |
| Immigrants | Uganda | 1.5 /100 | #233 | Tragic 44.6% |
| Immigrants | Panama | 1.3 /100 | #234 | Tragic 44.6% |
| Immigrants | Nicaragua | 1.2 /100 | #235 | Tragic 44.5% |
| Yaqui | 1.2 /100 | #236 | Tragic 44.5% |
| Comanche | 1.2 /100 | #237 | Tragic 44.5% |
| Immigrants | Uruguay | 1.1 /100 | #238 | Tragic 44.5% |
| Spanish Americans | 1.1 /100 | #239 | Tragic 44.5% |
| Ute | 1.0 /100 | #240 | Tragic 44.4% |
| Immigrants | Bosnia and Herzegovina | 1.0 /100 | #241 | Tragic 44.4% |
| Immigrants | Albania | 1.0 /100 | #242 | Tragic 44.4% |
Demographics Similar to Immigrants from Jamaica by Married-couple Households
In terms of married-couple households, the demographic groups most similar to Immigrants from Jamaica are Liberian (40.7%, a difference of 0.010%), Immigrants from Caribbean (40.8%, a difference of 0.29%), Bahamian (40.5%, a difference of 0.36%), Trinidadian and Tobagonian (40.9%, a difference of 0.47%), and Jamaican (40.9%, a difference of 0.55%).
| Demographics | Rating | Rank | Married-couple Households |
| Haitians | 0.0 /100 | #310 | Tragic 41.2% |
| Colville | 0.0 /100 | #311 | Tragic 41.0% |
| Africans | 0.0 /100 | #312 | Tragic 40.9% |
| Immigrants | Haiti | 0.0 /100 | #313 | Tragic 40.9% |
| Jamaicans | 0.0 /100 | #314 | Tragic 40.9% |
| Trinidadians and Tobagonians | 0.0 /100 | #315 | Tragic 40.9% |
| Immigrants | Caribbean | 0.0 /100 | #316 | Tragic 40.8% |
| Immigrants | Jamaica | 0.0 /100 | #317 | Tragic 40.7% |
| Liberians | 0.0 /100 | #318 | Tragic 40.7% |
| Bahamians | 0.0 /100 | #319 | Tragic 40.5% |
| West Indians | 0.0 /100 | #320 | Tragic 40.3% |
| Immigrants | Liberia | 0.0 /100 | #321 | Tragic 40.3% |
| Immigrants | Zaire | 0.0 /100 | #322 | Tragic 40.1% |
| Puerto Ricans | 0.0 /100 | #323 | Tragic 40.1% |
| Navajo | 0.0 /100 | #324 | Tragic 40.1% |