Immigrants from Moldova vs Sioux Married-couple Households
COMPARE
Immigrants from Moldova
Sioux
Married-couple Households
Married-couple Households Comparison
Immigrants from Moldova
Sioux
48.0%
MARRIED-COUPLE HOUSEHOLDS
97.0/ 100
METRIC RATING
91st/ 347
METRIC RANK
41.5%
MARRIED-COUPLE HOUSEHOLDS
0.0/ 100
METRIC RATING
305th/ 347
METRIC RANK
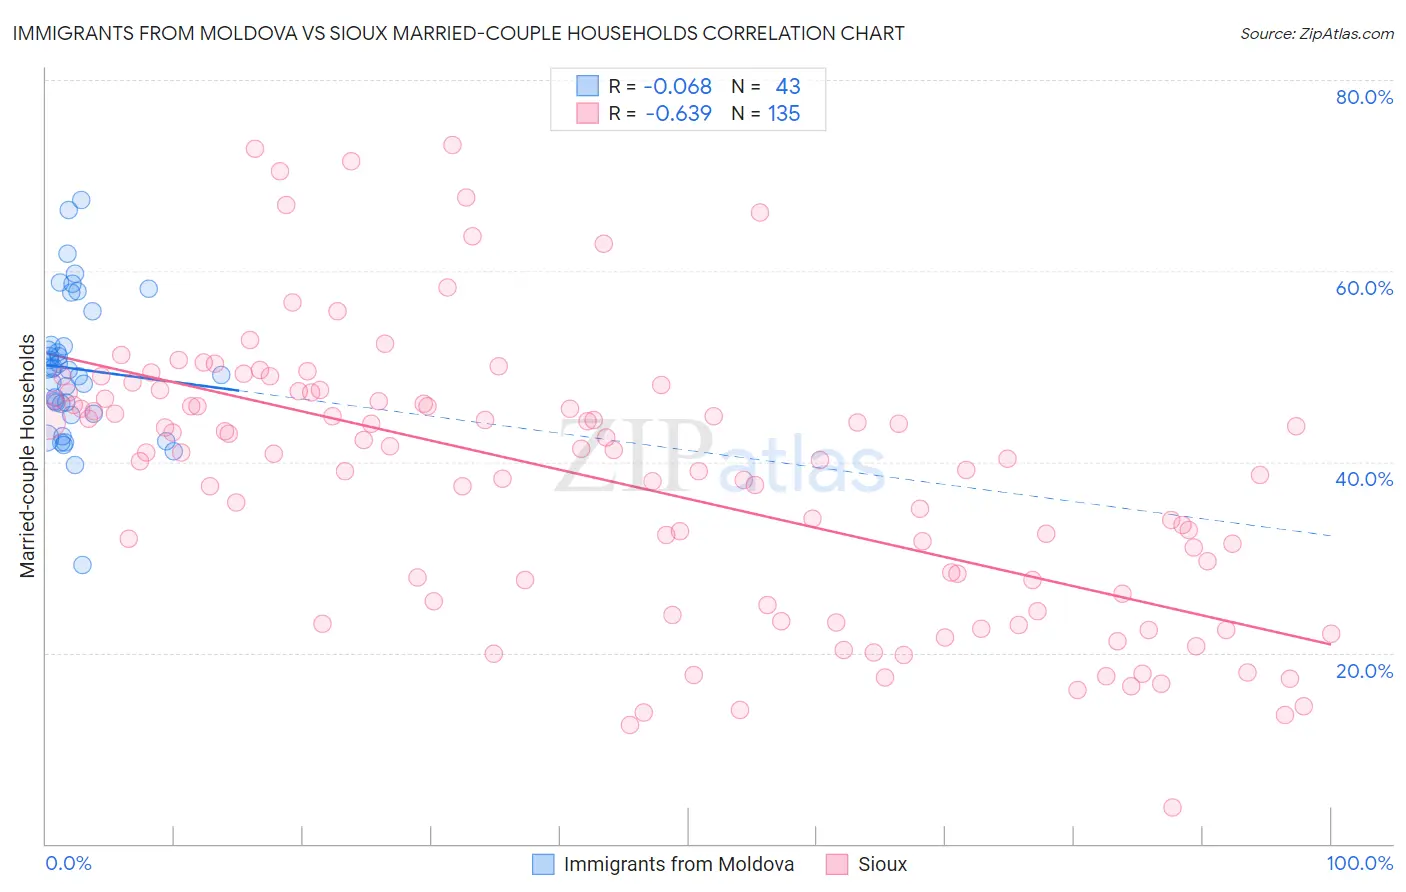
Immigrants from Moldova vs Sioux Married-couple Households Correlation Chart
The statistical analysis conducted on geographies consisting of 124,364,803 people shows a slight negative correlation between the proportion of Immigrants from Moldova and percentage of married-couple family households in the United States with a correlation coefficient (R) of -0.068 and weighted average of 48.0%. Similarly, the statistical analysis conducted on geographies consisting of 234,109,143 people shows a significant negative correlation between the proportion of Sioux and percentage of married-couple family households in the United States with a correlation coefficient (R) of -0.639 and weighted average of 41.5%, a difference of 15.5%.
Married-couple Households Correlation Summary
| Measurement | Immigrants from Moldova | Sioux |
| Minimum | 29.2% | 3.8% |
| Maximum | 67.4% | 73.2% |
| Range | 38.3% | 69.4% |
| Mean | 49.7% | 38.1% |
| Median | 49.6% | 40.9% |
| Interquartile 25% (IQ1) | 45.0% | 25.5% |
| Interquartile 75% (IQ3) | 52.2% | 46.7% |
| Interquartile Range (IQR) | 7.2% | 21.2% |
| Standard Deviation (Sample) | 7.4% | 14.3% |
| Standard Deviation (Population) | 7.3% | 14.3% |
Similar Demographics by Married-couple Households
Demographics Similar to Immigrants from Moldova by Married-couple Households
In terms of married-couple households, the demographic groups most similar to Immigrants from Moldova are Palestinian (48.0%, a difference of 0.020%), Lebanese (47.9%, a difference of 0.040%), American (47.9%, a difference of 0.040%), French (48.0%, a difference of 0.060%), and Immigrants from Belgium (47.9%, a difference of 0.070%).
| Demographics | Rating | Rank | Married-couple Households |
| Ukrainians | 97.6 /100 | #84 | Exceptional 48.1% |
| Immigrants | Israel | 97.4 /100 | #85 | Exceptional 48.0% |
| Belgians | 97.4 /100 | #86 | Exceptional 48.0% |
| Immigrants | Ireland | 97.3 /100 | #87 | Exceptional 48.0% |
| Afghans | 97.3 /100 | #88 | Exceptional 48.0% |
| Cypriots | 97.2 /100 | #89 | Exceptional 48.0% |
| French | 97.2 /100 | #90 | Exceptional 48.0% |
| Immigrants | Moldova | 97.0 /100 | #91 | Exceptional 48.0% |
| Palestinians | 96.9 /100 | #92 | Exceptional 48.0% |
| Lebanese | 96.9 /100 | #93 | Exceptional 47.9% |
| Americans | 96.9 /100 | #94 | Exceptional 47.9% |
| Immigrants | Belgium | 96.8 /100 | #95 | Exceptional 47.9% |
| Immigrants | Egypt | 96.6 /100 | #96 | Exceptional 47.9% |
| Latvians | 96.5 /100 | #97 | Exceptional 47.9% |
| Immigrants | North Macedonia | 96.4 /100 | #98 | Exceptional 47.9% |
Demographics Similar to Sioux by Married-couple Households
In terms of married-couple households, the demographic groups most similar to Sioux are Immigrants from Guyana (41.6%, a difference of 0.11%), Subsaharan African (41.6%, a difference of 0.22%), Immigrants from Honduras (41.6%, a difference of 0.23%), Guyanese (41.4%, a difference of 0.37%), and Immigrants from Western Africa (41.4%, a difference of 0.38%).
| Demographics | Rating | Rank | Married-couple Households |
| Immigrants | Middle Africa | 0.0 /100 | #298 | Tragic 41.8% |
| Immigrants | Ghana | 0.0 /100 | #299 | Tragic 41.8% |
| Immigrants | Belize | 0.0 /100 | #300 | Tragic 41.8% |
| Immigrants | Bahamas | 0.0 /100 | #301 | Tragic 41.7% |
| Immigrants | Honduras | 0.0 /100 | #302 | Tragic 41.6% |
| Sub-Saharan Africans | 0.0 /100 | #303 | Tragic 41.6% |
| Immigrants | Guyana | 0.0 /100 | #304 | Tragic 41.6% |
| Sioux | 0.0 /100 | #305 | Tragic 41.5% |
| Guyanese | 0.0 /100 | #306 | Tragic 41.4% |
| Immigrants | Western Africa | 0.0 /100 | #307 | Tragic 41.4% |
| Crow | 0.0 /100 | #308 | Tragic 41.4% |
| Immigrants | Trinidad and Tobago | 0.0 /100 | #309 | Tragic 41.2% |
| Haitians | 0.0 /100 | #310 | Tragic 41.2% |
| Colville | 0.0 /100 | #311 | Tragic 41.0% |
| Africans | 0.0 /100 | #312 | Tragic 40.9% |