Immigrants from Moldova vs Immigrants from Switzerland Married-couple Households
COMPARE
Immigrants from Moldova
Immigrants from Switzerland
Married-couple Households
Married-couple Households Comparison
Immigrants from Moldova
Immigrants from Switzerland
48.0%
MARRIED-COUPLE HOUSEHOLDS
97.0/ 100
METRIC RATING
91st/ 347
METRIC RANK
46.2%
MARRIED-COUPLE HOUSEHOLDS
36.9/ 100
METRIC RATING
184th/ 347
METRIC RANK
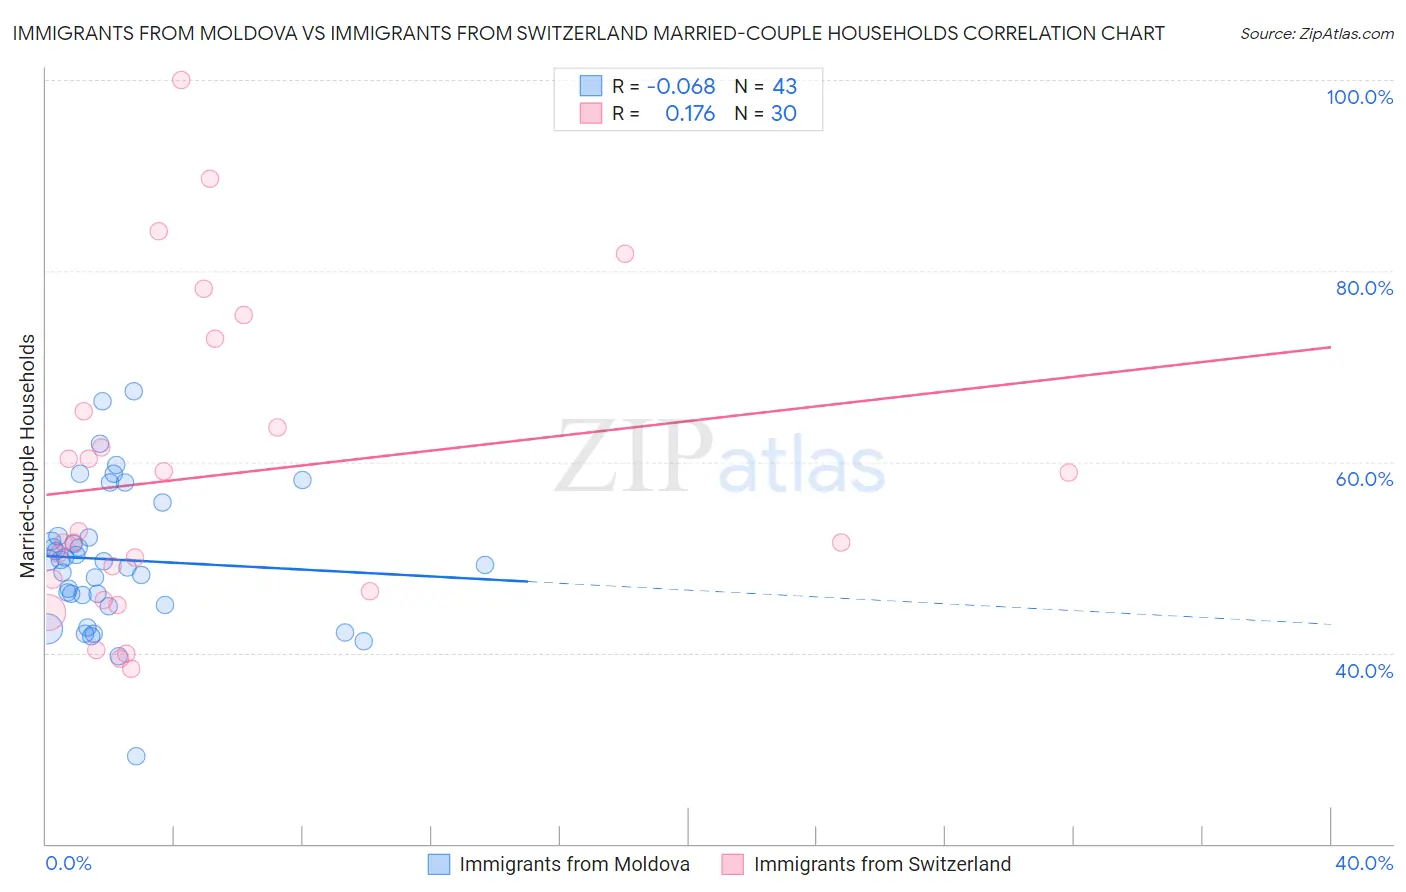
Immigrants from Moldova vs Immigrants from Switzerland Married-couple Households Correlation Chart
The statistical analysis conducted on geographies consisting of 124,364,803 people shows a slight negative correlation between the proportion of Immigrants from Moldova and percentage of married-couple family households in the United States with a correlation coefficient (R) of -0.068 and weighted average of 48.0%. Similarly, the statistical analysis conducted on geographies consisting of 148,072,536 people shows a poor positive correlation between the proportion of Immigrants from Switzerland and percentage of married-couple family households in the United States with a correlation coefficient (R) of 0.176 and weighted average of 46.2%, a difference of 3.8%.
Married-couple Households Correlation Summary
| Measurement | Immigrants from Moldova | Immigrants from Switzerland |
| Minimum | 29.2% | 38.3% |
| Maximum | 67.4% | 100.0% |
| Range | 38.3% | 61.7% |
| Mean | 49.7% | 58.5% |
| Median | 49.6% | 52.2% |
| Interquartile 25% (IQ1) | 45.0% | 46.4% |
| Interquartile 75% (IQ3) | 52.2% | 65.4% |
| Interquartile Range (IQR) | 7.2% | 19.0% |
| Standard Deviation (Sample) | 7.4% | 16.1% |
| Standard Deviation (Population) | 7.3% | 15.8% |
Similar Demographics by Married-couple Households
Demographics Similar to Immigrants from Moldova by Married-couple Households
In terms of married-couple households, the demographic groups most similar to Immigrants from Moldova are Palestinian (48.0%, a difference of 0.020%), Lebanese (47.9%, a difference of 0.040%), American (47.9%, a difference of 0.040%), French (48.0%, a difference of 0.060%), and Immigrants from Belgium (47.9%, a difference of 0.070%).
| Demographics | Rating | Rank | Married-couple Households |
| Ukrainians | 97.6 /100 | #84 | Exceptional 48.1% |
| Immigrants | Israel | 97.4 /100 | #85 | Exceptional 48.0% |
| Belgians | 97.4 /100 | #86 | Exceptional 48.0% |
| Immigrants | Ireland | 97.3 /100 | #87 | Exceptional 48.0% |
| Afghans | 97.3 /100 | #88 | Exceptional 48.0% |
| Cypriots | 97.2 /100 | #89 | Exceptional 48.0% |
| French | 97.2 /100 | #90 | Exceptional 48.0% |
| Immigrants | Moldova | 97.0 /100 | #91 | Exceptional 48.0% |
| Palestinians | 96.9 /100 | #92 | Exceptional 48.0% |
| Lebanese | 96.9 /100 | #93 | Exceptional 47.9% |
| Americans | 96.9 /100 | #94 | Exceptional 47.9% |
| Immigrants | Belgium | 96.8 /100 | #95 | Exceptional 47.9% |
| Immigrants | Egypt | 96.6 /100 | #96 | Exceptional 47.9% |
| Latvians | 96.5 /100 | #97 | Exceptional 47.9% |
| Immigrants | North Macedonia | 96.4 /100 | #98 | Exceptional 47.9% |
Demographics Similar to Immigrants from Switzerland by Married-couple Households
In terms of married-couple households, the demographic groups most similar to Immigrants from Switzerland are Brazilian (46.2%, a difference of 0.040%), Immigrants from Brazil (46.2%, a difference of 0.060%), Yugoslavian (46.2%, a difference of 0.080%), Mongolian (46.3%, a difference of 0.20%), and Malaysian (46.3%, a difference of 0.20%).
| Demographics | Rating | Rank | Married-couple Households |
| Immigrants | Immigrants | 43.8 /100 | #177 | Average 46.3% |
| Immigrants | Costa Rica | 43.4 /100 | #178 | Average 46.3% |
| Immigrants | Zimbabwe | 43.0 /100 | #179 | Average 46.3% |
| Mongolians | 42.0 /100 | #180 | Average 46.3% |
| Malaysians | 41.8 /100 | #181 | Average 46.3% |
| Yugoslavians | 38.9 /100 | #182 | Fair 46.2% |
| Immigrants | Brazil | 38.3 /100 | #183 | Fair 46.2% |
| Immigrants | Switzerland | 36.9 /100 | #184 | Fair 46.2% |
| Brazilians | 35.9 /100 | #185 | Fair 46.2% |
| Albanians | 31.1 /100 | #186 | Fair 46.1% |
| Fijians | 29.2 /100 | #187 | Fair 46.1% |
| South American Indians | 28.4 /100 | #188 | Fair 46.0% |
| Immigrants | Latvia | 26.9 /100 | #189 | Fair 46.0% |
| Immigrants | Kuwait | 25.6 /100 | #190 | Fair 46.0% |
| Choctaw | 24.9 /100 | #191 | Fair 46.0% |