Immigrants from Middle Africa vs Argentinean Family Households
COMPARE
Immigrants from Middle Africa
Argentinean
Family Households
Family Households Comparison
Immigrants from Middle Africa
Argentineans
61.9%
FAMILY HOUSEHOLDS
0.0/ 100
METRIC RATING
316th/ 347
METRIC RANK
65.0%
FAMILY HOUSEHOLDS
95.7/ 100
METRIC RATING
114th/ 347
METRIC RANK
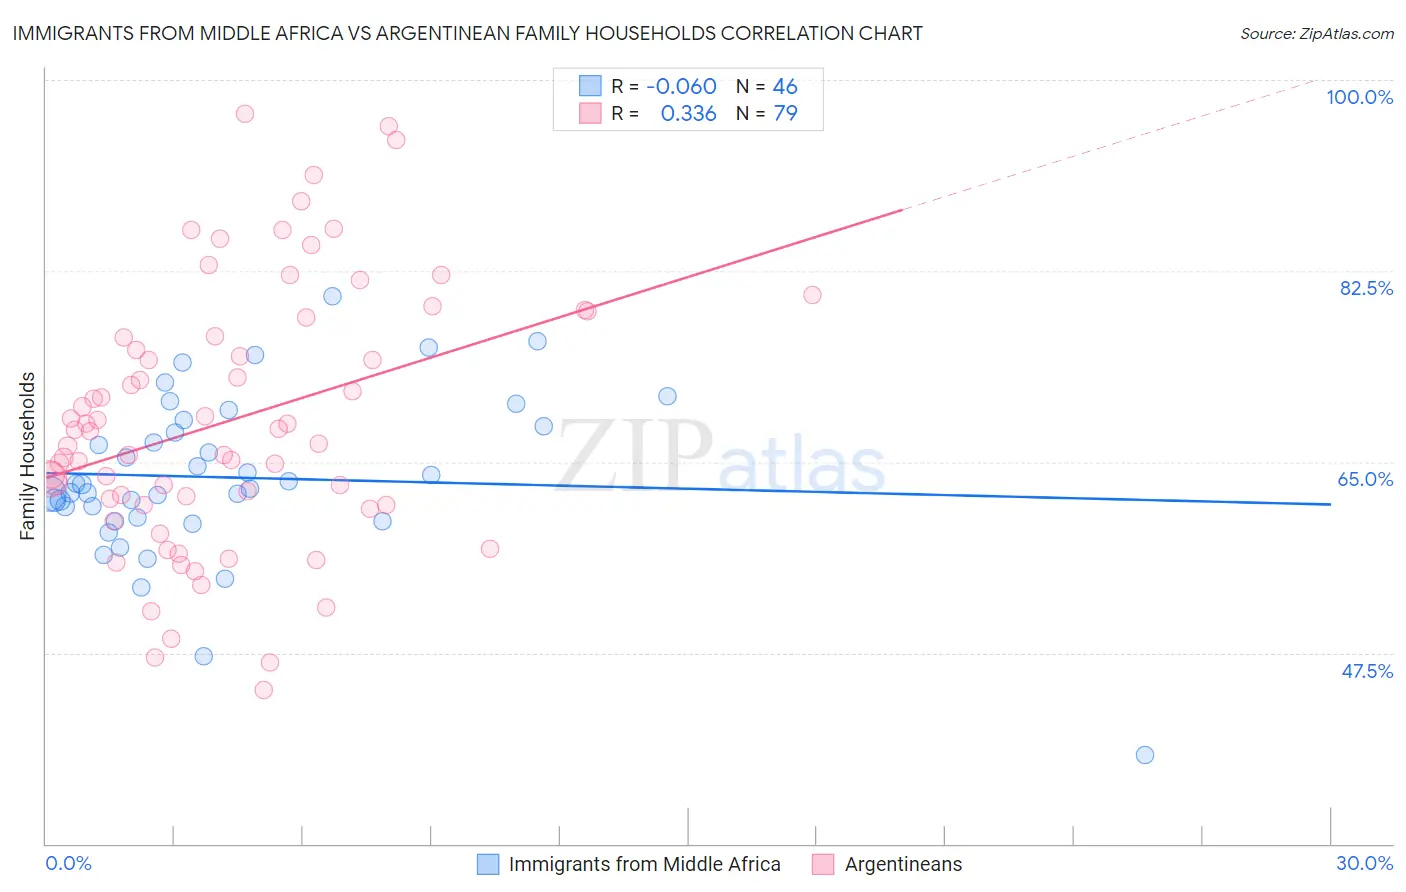
Immigrants from Middle Africa vs Argentinean Family Households Correlation Chart
The statistical analysis conducted on geographies consisting of 202,657,833 people shows a slight negative correlation between the proportion of Immigrants from Middle Africa and percentage of family households in the United States with a correlation coefficient (R) of -0.060 and weighted average of 61.9%. Similarly, the statistical analysis conducted on geographies consisting of 296,998,100 people shows a mild positive correlation between the proportion of Argentineans and percentage of family households in the United States with a correlation coefficient (R) of 0.336 and weighted average of 65.0%, a difference of 5.0%.
Family Households Correlation Summary
| Measurement | Immigrants from Middle Africa | Argentinean |
| Minimum | 38.1% | 44.1% |
| Maximum | 80.2% | 96.9% |
| Range | 42.1% | 52.8% |
| Mean | 63.6% | 68.8% |
| Median | 62.7% | 67.8% |
| Interquartile 25% (IQ1) | 60.0% | 61.1% |
| Interquartile 75% (IQ3) | 68.3% | 76.5% |
| Interquartile Range (IQR) | 8.4% | 15.4% |
| Standard Deviation (Sample) | 7.5% | 11.9% |
| Standard Deviation (Population) | 7.5% | 11.8% |
Similar Demographics by Family Households
Demographics Similar to Immigrants from Middle Africa by Family Households
In terms of family households, the demographic groups most similar to Immigrants from Middle Africa are Moroccan (61.9%, a difference of 0.040%), Immigrants from Bosnia and Herzegovina (61.9%, a difference of 0.040%), Immigrants from Cabo Verde (61.9%, a difference of 0.080%), Alaskan Athabascan (61.8%, a difference of 0.12%), and Liberian (62.0%, a difference of 0.13%).
| Demographics | Rating | Rank | Family Households |
| Sub-Saharan Africans | 0.0 /100 | #309 | Tragic 62.1% |
| Immigrants | Liberia | 0.0 /100 | #310 | Tragic 62.0% |
| Immigrants | Morocco | 0.0 /100 | #311 | Tragic 62.0% |
| Immigrants | Latvia | 0.0 /100 | #312 | Tragic 62.0% |
| Liberians | 0.0 /100 | #313 | Tragic 62.0% |
| Immigrants | Cabo Verde | 0.0 /100 | #314 | Tragic 61.9% |
| Moroccans | 0.0 /100 | #315 | Tragic 61.9% |
| Immigrants | Middle Africa | 0.0 /100 | #316 | Tragic 61.9% |
| Immigrants | Bosnia and Herzegovina | 0.0 /100 | #317 | Tragic 61.9% |
| Alaskan Athabascans | 0.0 /100 | #318 | Tragic 61.8% |
| Cape Verdeans | 0.0 /100 | #319 | Tragic 61.8% |
| Ugandans | 0.0 /100 | #320 | Tragic 61.7% |
| Alsatians | 0.0 /100 | #321 | Tragic 61.7% |
| Immigrants | Serbia | 0.0 /100 | #322 | Tragic 61.6% |
| Tlingit-Haida | 0.0 /100 | #323 | Tragic 61.6% |
Demographics Similar to Argentineans by Family Households
In terms of family households, the demographic groups most similar to Argentineans are Ecuadorian (65.0%, a difference of 0.030%), Immigrants from Iraq (65.0%, a difference of 0.030%), Cherokee (65.0%, a difference of 0.030%), Spanish (65.0%, a difference of 0.040%), and Dutch (64.9%, a difference of 0.050%).
| Demographics | Rating | Rank | Family Households |
| Alaska Natives | 97.3 /100 | #107 | Exceptional 65.1% |
| Palestinians | 97.2 /100 | #108 | Exceptional 65.1% |
| Immigrants | Guatemala | 96.9 /100 | #109 | Exceptional 65.0% |
| Scandinavians | 96.8 /100 | #110 | Exceptional 65.0% |
| Europeans | 96.8 /100 | #111 | Exceptional 65.0% |
| Immigrants | Jordan | 96.5 /100 | #112 | Exceptional 65.0% |
| Spanish | 96.2 /100 | #113 | Exceptional 65.0% |
| Argentineans | 95.7 /100 | #114 | Exceptional 65.0% |
| Ecuadorians | 95.4 /100 | #115 | Exceptional 65.0% |
| Immigrants | Iraq | 95.4 /100 | #116 | Exceptional 65.0% |
| Cherokee | 95.3 /100 | #117 | Exceptional 65.0% |
| Dutch | 95.1 /100 | #118 | Exceptional 64.9% |
| Immigrants | Eastern Asia | 94.4 /100 | #119 | Exceptional 64.9% |
| Immigrants | Oceania | 94.2 /100 | #120 | Exceptional 64.9% |
| Hungarians | 94.0 /100 | #121 | Exceptional 64.9% |