Immigrants from Lithuania vs Swiss Births to Unmarried Women
COMPARE
Immigrants from Lithuania
Swiss
Births to Unmarried Women
Births to Unmarried Women Comparison
Immigrants from Lithuania
Swiss
27.7%
BIRTHS TO UNMARRIED WOMEN
99.5/ 100
METRIC RATING
46th/ 347
METRIC RANK
30.5%
BIRTHS TO UNMARRIED WOMEN
83.1/ 100
METRIC RATING
140th/ 347
METRIC RANK
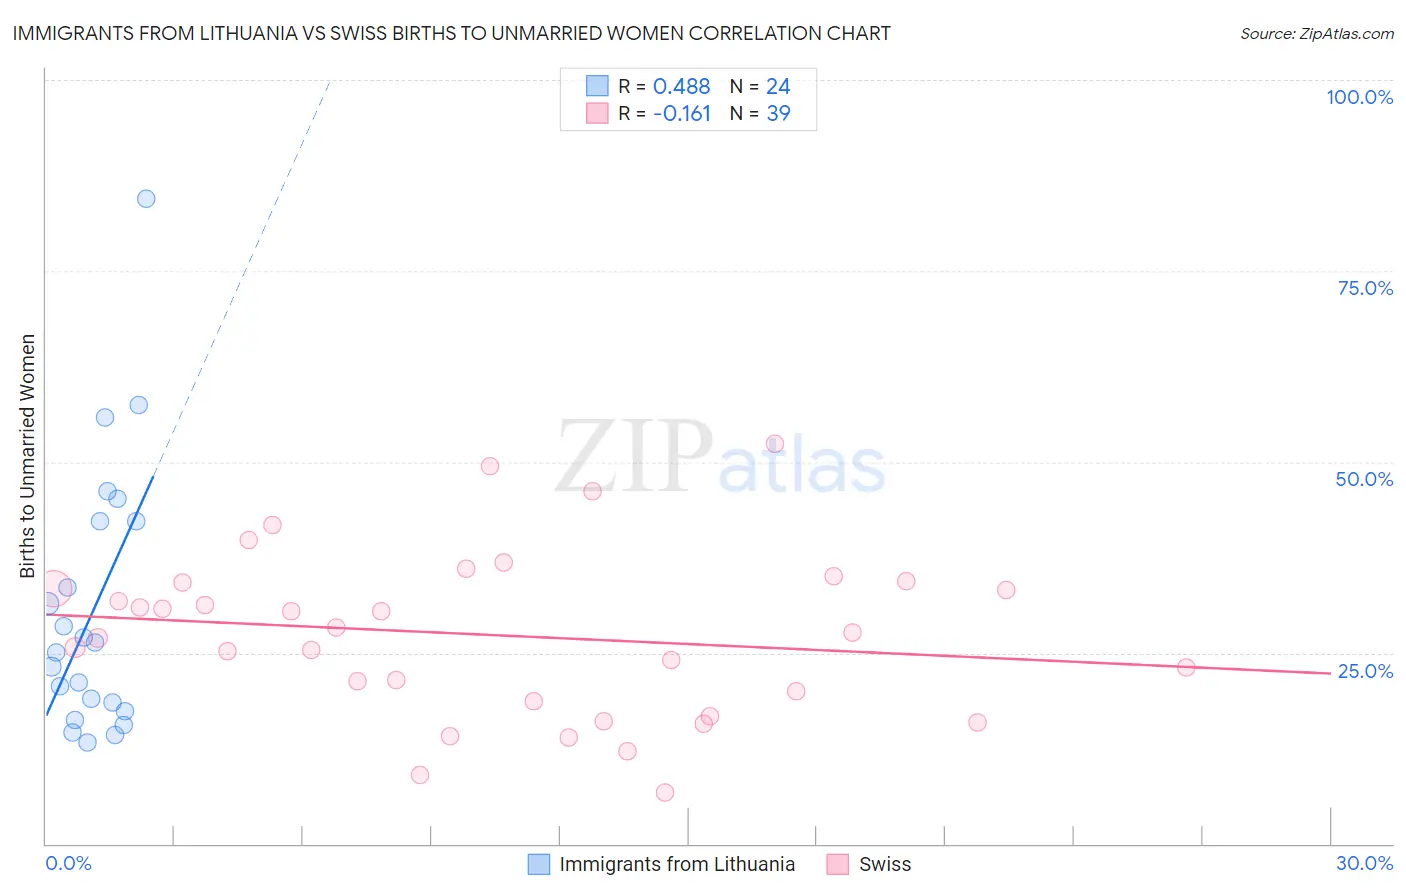
Immigrants from Lithuania vs Swiss Births to Unmarried Women Correlation Chart
The statistical analysis conducted on geographies consisting of 112,678,576 people shows a moderate positive correlation between the proportion of Immigrants from Lithuania and percentage of births to unmarried women in the United States with a correlation coefficient (R) of 0.488 and weighted average of 27.7%. Similarly, the statistical analysis conducted on geographies consisting of 422,325,964 people shows a poor negative correlation between the proportion of Swiss and percentage of births to unmarried women in the United States with a correlation coefficient (R) of -0.161 and weighted average of 30.5%, a difference of 9.9%.
Births to Unmarried Women Correlation Summary
| Measurement | Immigrants from Lithuania | Swiss |
| Minimum | 13.2% | 6.7% |
| Maximum | 84.4% | 52.4% |
| Range | 71.3% | 45.7% |
| Mean | 30.8% | 27.3% |
| Median | 25.7% | 27.7% |
| Interquartile 25% (IQ1) | 17.9% | 18.6% |
| Interquartile 75% (IQ3) | 42.3% | 34.3% |
| Interquartile Range (IQR) | 24.4% | 15.6% |
| Standard Deviation (Sample) | 17.5% | 10.8% |
| Standard Deviation (Population) | 17.1% | 10.6% |
Similar Demographics by Births to Unmarried Women
Demographics Similar to Immigrants from Lithuania by Births to Unmarried Women
In terms of births to unmarried women, the demographic groups most similar to Immigrants from Lithuania are Hmong (27.7%, a difference of 0.0%), Eastern European (27.7%, a difference of 0.010%), Latvian (27.7%, a difference of 0.040%), Immigrants from Indonesia (27.7%, a difference of 0.14%), and Immigrants from Greece (27.8%, a difference of 0.20%).
| Demographics | Rating | Rank | Births to Unmarried Women |
| Immigrants | Malaysia | 99.7 /100 | #39 | Exceptional 27.4% |
| Turks | 99.6 /100 | #40 | Exceptional 27.4% |
| Iraqis | 99.6 /100 | #41 | Exceptional 27.6% |
| Immigrants | Eastern Europe | 99.6 /100 | #42 | Exceptional 27.6% |
| Immigrants | Bulgaria | 99.6 /100 | #43 | Exceptional 27.6% |
| Immigrants | Indonesia | 99.5 /100 | #44 | Exceptional 27.7% |
| Latvians | 99.5 /100 | #45 | Exceptional 27.7% |
| Immigrants | Lithuania | 99.5 /100 | #46 | Exceptional 27.7% |
| Hmong | 99.5 /100 | #47 | Exceptional 27.7% |
| Eastern Europeans | 99.5 /100 | #48 | Exceptional 27.7% |
| Immigrants | Greece | 99.4 /100 | #49 | Exceptional 27.8% |
| Maltese | 99.4 /100 | #50 | Exceptional 27.8% |
| Macedonians | 99.4 /100 | #51 | Exceptional 27.9% |
| Bhutanese | 99.4 /100 | #52 | Exceptional 27.9% |
| Immigrants | Romania | 99.4 /100 | #53 | Exceptional 27.9% |
Demographics Similar to Swiss by Births to Unmarried Women
In terms of births to unmarried women, the demographic groups most similar to Swiss are Pakistani (30.5%, a difference of 0.020%), South African (30.5%, a difference of 0.080%), Immigrants from Uganda (30.5%, a difference of 0.10%), Immigrants from Canada (30.4%, a difference of 0.11%), and Immigrants from Philippines (30.4%, a difference of 0.14%).
| Demographics | Rating | Rank | Births to Unmarried Women |
| Immigrants | Morocco | 85.2 /100 | #133 | Excellent 30.4% |
| Immigrants | South Eastern Asia | 85.2 /100 | #134 | Excellent 30.4% |
| Brazilians | 84.8 /100 | #135 | Excellent 30.4% |
| Immigrants | Scotland | 84.6 /100 | #136 | Excellent 30.4% |
| Immigrants | Philippines | 83.9 /100 | #137 | Excellent 30.4% |
| Puget Sound Salish | 83.9 /100 | #138 | Excellent 30.4% |
| Immigrants | Canada | 83.7 /100 | #139 | Excellent 30.4% |
| Swiss | 83.1 /100 | #140 | Excellent 30.5% |
| Pakistanis | 83.0 /100 | #141 | Excellent 30.5% |
| South Africans | 82.7 /100 | #142 | Excellent 30.5% |
| Immigrants | Uganda | 82.6 /100 | #143 | Excellent 30.5% |
| Czechs | 82.1 /100 | #144 | Excellent 30.5% |
| Immigrants | North America | 81.5 /100 | #145 | Excellent 30.6% |
| Northern Europeans | 81.4 /100 | #146 | Excellent 30.6% |
| Immigrants | Oceania | 81.2 /100 | #147 | Excellent 30.6% |