Immigrants from Lithuania vs Swiss College, 1 year or more
COMPARE
Immigrants from Lithuania
Swiss
College, 1 year or more
College, 1 year or more Comparison
Immigrants from Lithuania
Swiss
64.6%
COLLEGE, 1 YEAR OR MORE
99.9/ 100
METRIC RATING
45th/ 347
METRIC RANK
59.2%
COLLEGE, 1 YEAR OR MORE
43.4/ 100
METRIC RATING
181st/ 347
METRIC RANK
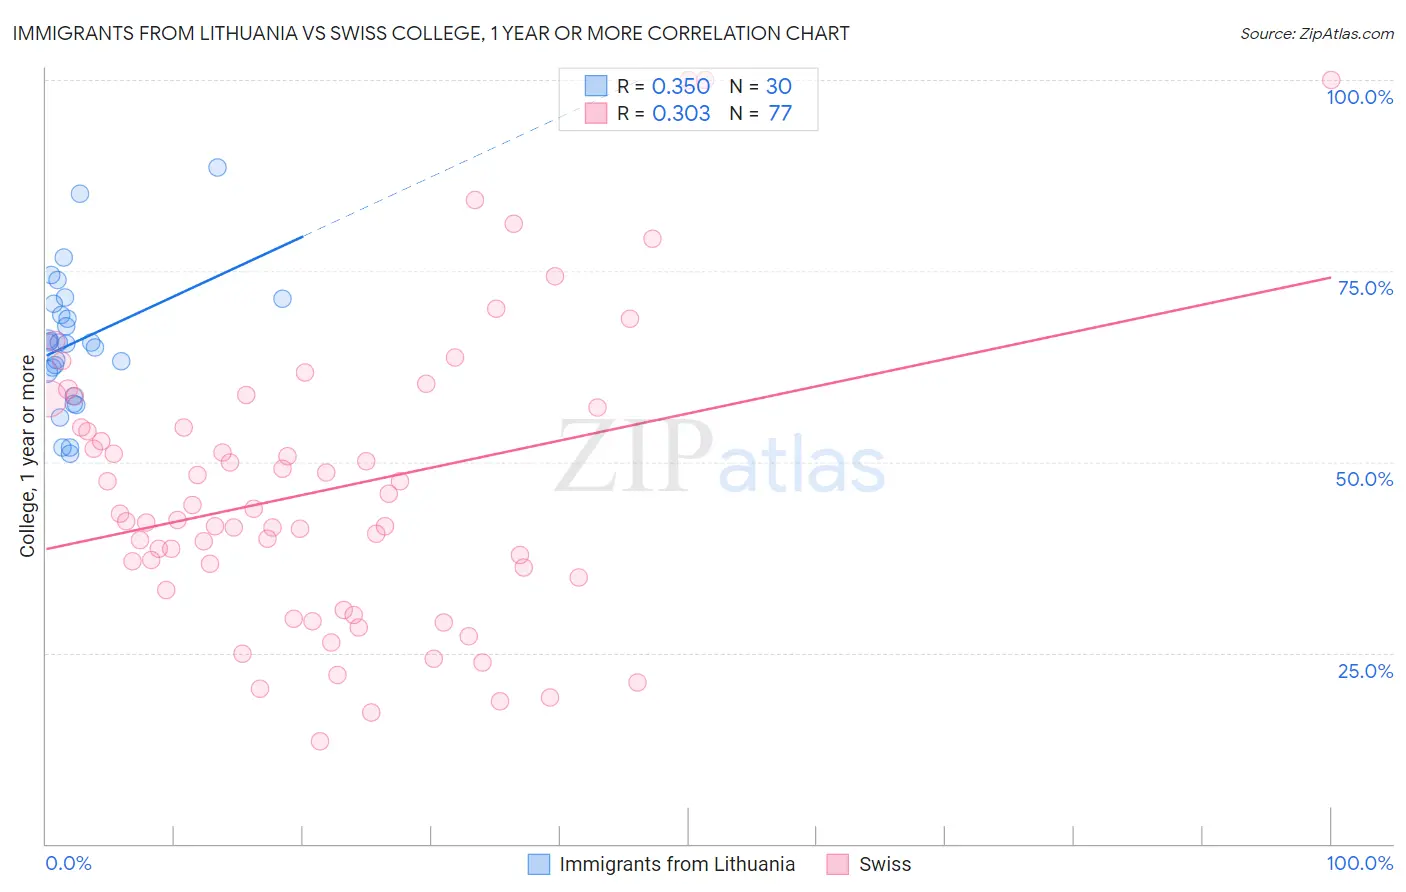
Immigrants from Lithuania vs Swiss College, 1 year or more Correlation Chart
The statistical analysis conducted on geographies consisting of 117,724,932 people shows a mild positive correlation between the proportion of Immigrants from Lithuania and percentage of population with at least college, 1 year or more education in the United States with a correlation coefficient (R) of 0.350 and weighted average of 64.6%. Similarly, the statistical analysis conducted on geographies consisting of 465,017,348 people shows a mild positive correlation between the proportion of Swiss and percentage of population with at least college, 1 year or more education in the United States with a correlation coefficient (R) of 0.303 and weighted average of 59.2%, a difference of 9.1%.
College, 1 year or more Correlation Summary
| Measurement | Immigrants from Lithuania | Swiss |
| Minimum | 51.1% | 13.4% |
| Maximum | 88.5% | 100.0% |
| Range | 37.4% | 86.6% |
| Mean | 65.8% | 46.3% |
| Median | 65.6% | 42.4% |
| Interquartile 25% (IQ1) | 61.9% | 34.1% |
| Interquartile 75% (IQ3) | 70.7% | 55.8% |
| Interquartile Range (IQR) | 8.8% | 21.7% |
| Standard Deviation (Sample) | 8.7% | 18.9% |
| Standard Deviation (Population) | 8.6% | 18.8% |
Similar Demographics by College, 1 year or more
Demographics Similar to Immigrants from Lithuania by College, 1 year or more
In terms of college, 1 year or more, the demographic groups most similar to Immigrants from Lithuania are Bhutanese (64.6%, a difference of 0.010%), Australian (64.6%, a difference of 0.020%), Immigrants from Bulgaria (64.6%, a difference of 0.050%), New Zealander (64.6%, a difference of 0.080%), and Immigrants from Norway (64.7%, a difference of 0.17%).
| Demographics | Rating | Rank | College, 1 year or more |
| Immigrants | Saudi Arabia | 99.9 /100 | #38 | Exceptional 65.0% |
| Estonians | 99.9 /100 | #39 | Exceptional 65.0% |
| Immigrants | Kuwait | 99.9 /100 | #40 | Exceptional 65.0% |
| Mongolians | 99.9 /100 | #41 | Exceptional 64.8% |
| Immigrants | Latvia | 99.9 /100 | #42 | Exceptional 64.8% |
| Immigrants | Russia | 99.9 /100 | #43 | Exceptional 64.7% |
| Immigrants | Norway | 99.9 /100 | #44 | Exceptional 64.7% |
| Immigrants | Lithuania | 99.9 /100 | #45 | Exceptional 64.6% |
| Bhutanese | 99.9 /100 | #46 | Exceptional 64.6% |
| Australians | 99.9 /100 | #47 | Exceptional 64.6% |
| Immigrants | Bulgaria | 99.9 /100 | #48 | Exceptional 64.6% |
| New Zealanders | 99.9 /100 | #49 | Exceptional 64.6% |
| Immigrants | Austria | 99.8 /100 | #50 | Exceptional 64.4% |
| Immigrants | Malaysia | 99.8 /100 | #51 | Exceptional 64.3% |
| Immigrants | Netherlands | 99.8 /100 | #52 | Exceptional 64.2% |
Demographics Similar to Swiss by College, 1 year or more
In terms of college, 1 year or more, the demographic groups most similar to Swiss are Immigrants from Bosnia and Herzegovina (59.2%, a difference of 0.030%), Yugoslavian (59.2%, a difference of 0.040%), Bermudan (59.3%, a difference of 0.17%), German Russian (59.1%, a difference of 0.22%), and Tlingit-Haida (59.4%, a difference of 0.27%).
| Demographics | Rating | Rank | College, 1 year or more |
| Celtics | 50.0 /100 | #174 | Average 59.4% |
| Sri Lankans | 49.0 /100 | #175 | Average 59.4% |
| Immigrants | Poland | 48.9 /100 | #176 | Average 59.4% |
| Tlingit-Haida | 48.4 /100 | #177 | Average 59.4% |
| Czechoslovakians | 48.3 /100 | #178 | Average 59.4% |
| Bermudans | 46.6 /100 | #179 | Average 59.3% |
| Yugoslavians | 44.1 /100 | #180 | Average 59.2% |
| Swiss | 43.4 /100 | #181 | Average 59.2% |
| Immigrants | Bosnia and Herzegovina | 42.8 /100 | #182 | Average 59.2% |
| German Russians | 39.3 /100 | #183 | Fair 59.1% |
| Spaniards | 38.3 /100 | #184 | Fair 59.0% |
| South Americans | 35.9 /100 | #185 | Fair 59.0% |
| Scotch-Irish | 34.7 /100 | #186 | Fair 58.9% |
| Germans | 34.7 /100 | #187 | Fair 58.9% |
| French | 34.4 /100 | #188 | Fair 58.9% |