Italian vs Swiss Births to Unmarried Women
COMPARE
Italian
Swiss
Births to Unmarried Women
Births to Unmarried Women Comparison
Italians
Swiss
30.8%
BIRTHS TO UNMARRIED WOMEN
77.0/ 100
METRIC RATING
151st/ 347
METRIC RANK
30.5%
BIRTHS TO UNMARRIED WOMEN
83.1/ 100
METRIC RATING
140th/ 347
METRIC RANK
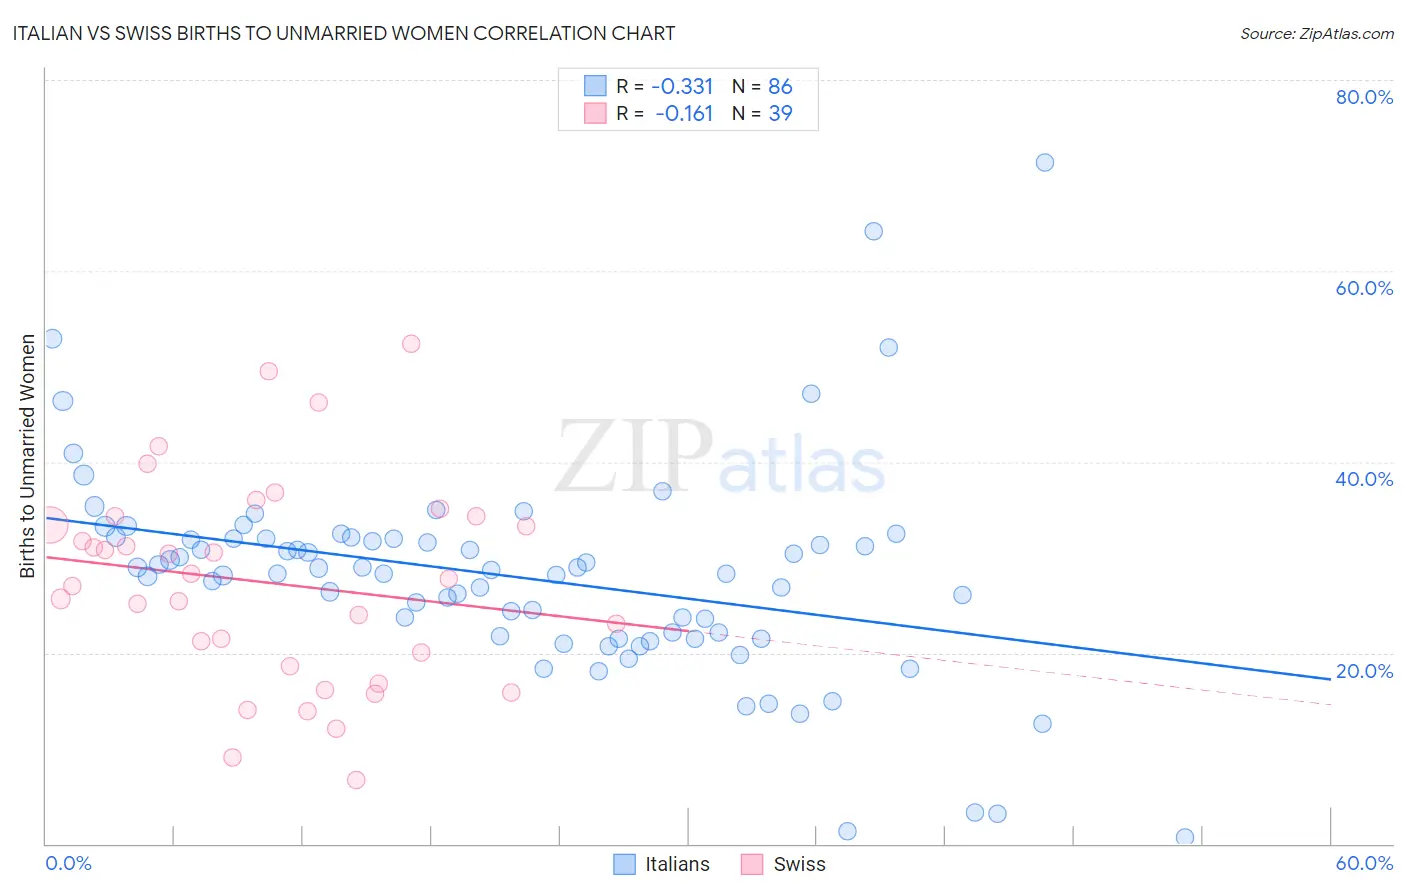
Italian vs Swiss Births to Unmarried Women Correlation Chart
The statistical analysis conducted on geographies consisting of 508,502,070 people shows a mild negative correlation between the proportion of Italians and percentage of births to unmarried women in the United States with a correlation coefficient (R) of -0.331 and weighted average of 30.8%. Similarly, the statistical analysis conducted on geographies consisting of 422,325,964 people shows a poor negative correlation between the proportion of Swiss and percentage of births to unmarried women in the United States with a correlation coefficient (R) of -0.161 and weighted average of 30.5%, a difference of 0.96%.
Births to Unmarried Women Correlation Summary
| Measurement | Italian | Swiss |
| Minimum | 0.60% | 6.7% |
| Maximum | 71.4% | 52.4% |
| Range | 70.8% | 45.7% |
| Mean | 28.0% | 27.3% |
| Median | 28.5% | 27.7% |
| Interquartile 25% (IQ1) | 21.7% | 18.6% |
| Interquartile 75% (IQ3) | 31.9% | 34.3% |
| Interquartile Range (IQR) | 10.2% | 15.6% |
| Standard Deviation (Sample) | 11.2% | 10.8% |
| Standard Deviation (Population) | 11.1% | 10.6% |
Demographics Similar to Italians and Swiss by Births to Unmarried Women
In terms of births to unmarried women, the demographic groups most similar to Italians are Somali (30.7%, a difference of 0.11%), Polish (30.8%, a difference of 0.11%), British (30.8%, a difference of 0.13%), Yugoslavian (30.8%, a difference of 0.25%), and Serbian (30.7%, a difference of 0.26%). Similarly, the demographic groups most similar to Swiss are Pakistani (30.5%, a difference of 0.020%), South African (30.5%, a difference of 0.080%), Immigrants from Uganda (30.5%, a difference of 0.10%), Immigrants from Canada (30.4%, a difference of 0.11%), and Immigrants from Philippines (30.4%, a difference of 0.14%).
| Demographics | Rating | Rank | Births to Unmarried Women |
| Brazilians | 84.8 /100 | #135 | Excellent 30.4% |
| Immigrants | Scotland | 84.6 /100 | #136 | Excellent 30.4% |
| Immigrants | Philippines | 83.9 /100 | #137 | Excellent 30.4% |
| Puget Sound Salish | 83.9 /100 | #138 | Excellent 30.4% |
| Immigrants | Canada | 83.7 /100 | #139 | Excellent 30.4% |
| Swiss | 83.1 /100 | #140 | Excellent 30.5% |
| Pakistanis | 83.0 /100 | #141 | Excellent 30.5% |
| South Africans | 82.7 /100 | #142 | Excellent 30.5% |
| Immigrants | Uganda | 82.6 /100 | #143 | Excellent 30.5% |
| Czechs | 82.1 /100 | #144 | Excellent 30.5% |
| Immigrants | North America | 81.5 /100 | #145 | Excellent 30.6% |
| Northern Europeans | 81.4 /100 | #146 | Excellent 30.6% |
| Immigrants | Oceania | 81.2 /100 | #147 | Excellent 30.6% |
| Chileans | 79.1 /100 | #148 | Good 30.7% |
| Serbians | 78.8 /100 | #149 | Good 30.7% |
| Somalis | 77.8 /100 | #150 | Good 30.7% |
| Italians | 77.0 /100 | #151 | Good 30.8% |
| Poles | 76.2 /100 | #152 | Good 30.8% |
| British | 76.0 /100 | #153 | Good 30.8% |
| Yugoslavians | 75.1 /100 | #154 | Good 30.8% |
| Immigrants | Bangladesh | 73.9 /100 | #155 | Good 30.9% |