Immigrants from Latvia vs Immigrants from Colombia Married-couple Households
COMPARE
Immigrants from Latvia
Immigrants from Colombia
Married-couple Households
Married-couple Households Comparison
Immigrants from Latvia
Immigrants from Colombia
46.0%
MARRIED-COUPLE HOUSEHOLDS
26.9/ 100
METRIC RATING
189th/ 347
METRIC RANK
46.4%
MARRIED-COUPLE HOUSEHOLDS
46.1/ 100
METRIC RATING
175th/ 347
METRIC RANK
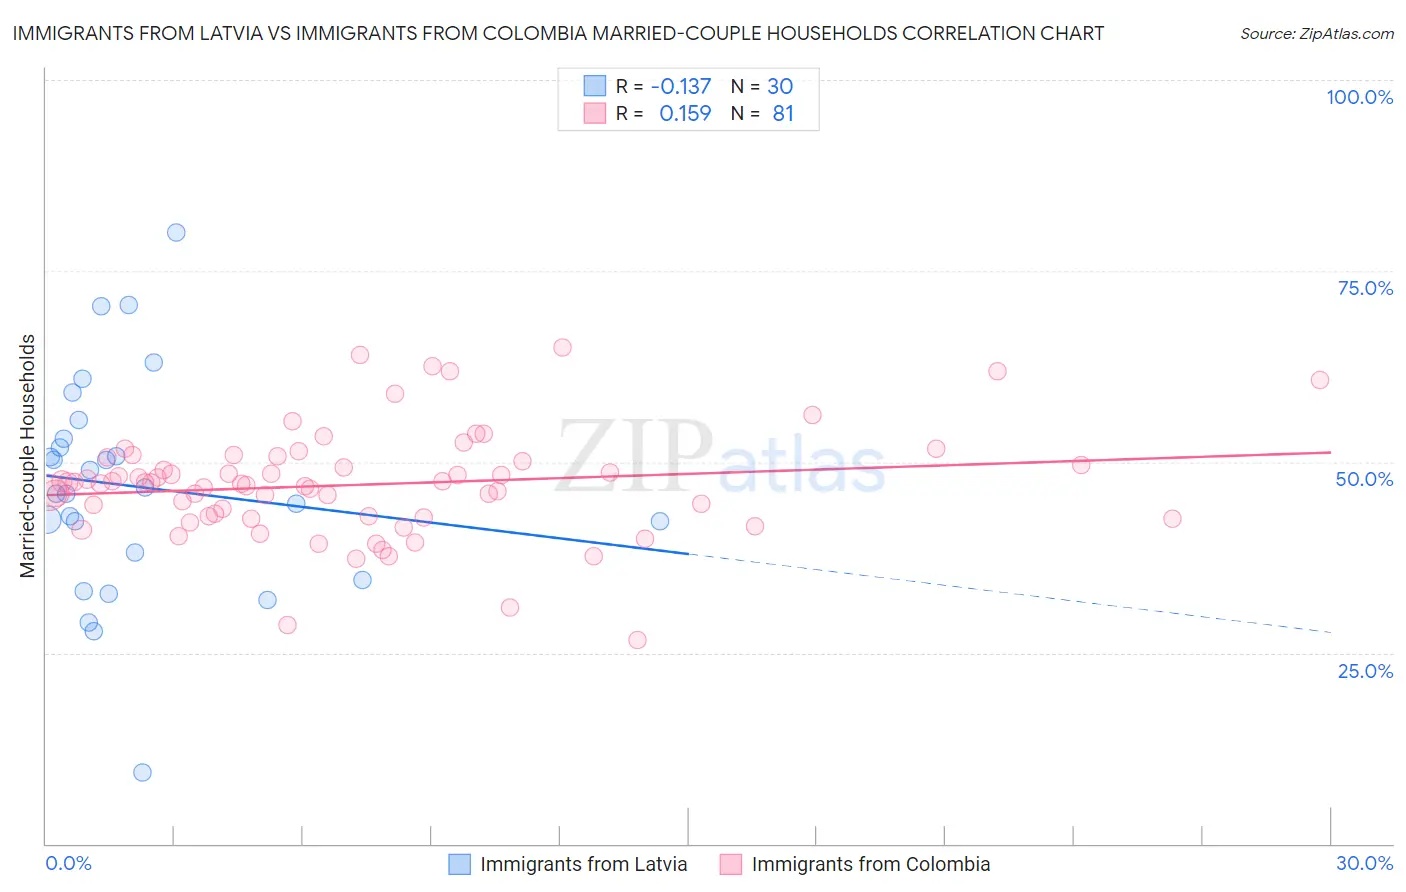
Immigrants from Latvia vs Immigrants from Colombia Married-couple Households Correlation Chart
The statistical analysis conducted on geographies consisting of 113,732,502 people shows a poor negative correlation between the proportion of Immigrants from Latvia and percentage of married-couple family households in the United States with a correlation coefficient (R) of -0.137 and weighted average of 46.0%. Similarly, the statistical analysis conducted on geographies consisting of 378,499,712 people shows a poor positive correlation between the proportion of Immigrants from Colombia and percentage of married-couple family households in the United States with a correlation coefficient (R) of 0.159 and weighted average of 46.4%, a difference of 0.80%.
Married-couple Households Correlation Summary
| Measurement | Immigrants from Latvia | Immigrants from Colombia |
| Minimum | 9.2% | 26.7% |
| Maximum | 80.0% | 64.9% |
| Range | 70.8% | 38.2% |
| Mean | 46.8% | 47.0% |
| Median | 46.2% | 47.3% |
| Interquartile 25% (IQ1) | 38.2% | 42.8% |
| Interquartile 75% (IQ3) | 53.0% | 50.4% |
| Interquartile Range (IQR) | 14.8% | 7.5% |
| Standard Deviation (Sample) | 14.4% | 7.1% |
| Standard Deviation (Population) | 14.2% | 7.1% |
Demographics Similar to Immigrants from Latvia and Immigrants from Colombia by Married-couple Households
In terms of married-couple households, the demographic groups most similar to Immigrants from Latvia are Immigrants from Kuwait (46.0%, a difference of 0.060%), South American Indian (46.0%, a difference of 0.070%), Choctaw (46.0%, a difference of 0.10%), Fijian (46.1%, a difference of 0.11%), and Immigrants from Northern Africa (46.0%, a difference of 0.11%). Similarly, the demographic groups most similar to Immigrants from Colombia are Cajun (46.4%, a difference of 0.030%), Immigrants (46.3%, a difference of 0.090%), Immigrants from Costa Rica (46.3%, a difference of 0.10%), Immigrants from Zimbabwe (46.3%, a difference of 0.12%), and Immigrants from Mexico (46.4%, a difference of 0.15%).
| Demographics | Rating | Rank | Married-couple Households |
| Immigrants | Australia | 54.6 /100 | #172 | Average 46.5% |
| Immigrants | Norway | 52.0 /100 | #173 | Average 46.5% |
| Immigrants | Mexico | 50.0 /100 | #174 | Average 46.4% |
| Immigrants | Colombia | 46.1 /100 | #175 | Average 46.4% |
| Cajuns | 45.2 /100 | #176 | Average 46.4% |
| Immigrants | Immigrants | 43.8 /100 | #177 | Average 46.3% |
| Immigrants | Costa Rica | 43.4 /100 | #178 | Average 46.3% |
| Immigrants | Zimbabwe | 43.0 /100 | #179 | Average 46.3% |
| Mongolians | 42.0 /100 | #180 | Average 46.3% |
| Malaysians | 41.8 /100 | #181 | Average 46.3% |
| Yugoslavians | 38.9 /100 | #182 | Fair 46.2% |
| Immigrants | Brazil | 38.3 /100 | #183 | Fair 46.2% |
| Immigrants | Switzerland | 36.9 /100 | #184 | Fair 46.2% |
| Brazilians | 35.9 /100 | #185 | Fair 46.2% |
| Albanians | 31.1 /100 | #186 | Fair 46.1% |
| Fijians | 29.2 /100 | #187 | Fair 46.1% |
| South American Indians | 28.4 /100 | #188 | Fair 46.0% |
| Immigrants | Latvia | 26.9 /100 | #189 | Fair 46.0% |
| Immigrants | Kuwait | 25.6 /100 | #190 | Fair 46.0% |
| Choctaw | 24.9 /100 | #191 | Fair 46.0% |
| Immigrants | Northern Africa | 24.6 /100 | #192 | Fair 46.0% |