Immigrants from India vs Immigrants from Colombia Married-couple Households
COMPARE
Immigrants from India
Immigrants from Colombia
Married-couple Households
Married-couple Households Comparison
Immigrants from India
Immigrants from Colombia
52.7%
MARRIED-COUPLE HOUSEHOLDS
100.0/ 100
METRIC RATING
1st/ 347
METRIC RANK
46.4%
MARRIED-COUPLE HOUSEHOLDS
46.1/ 100
METRIC RATING
175th/ 347
METRIC RANK
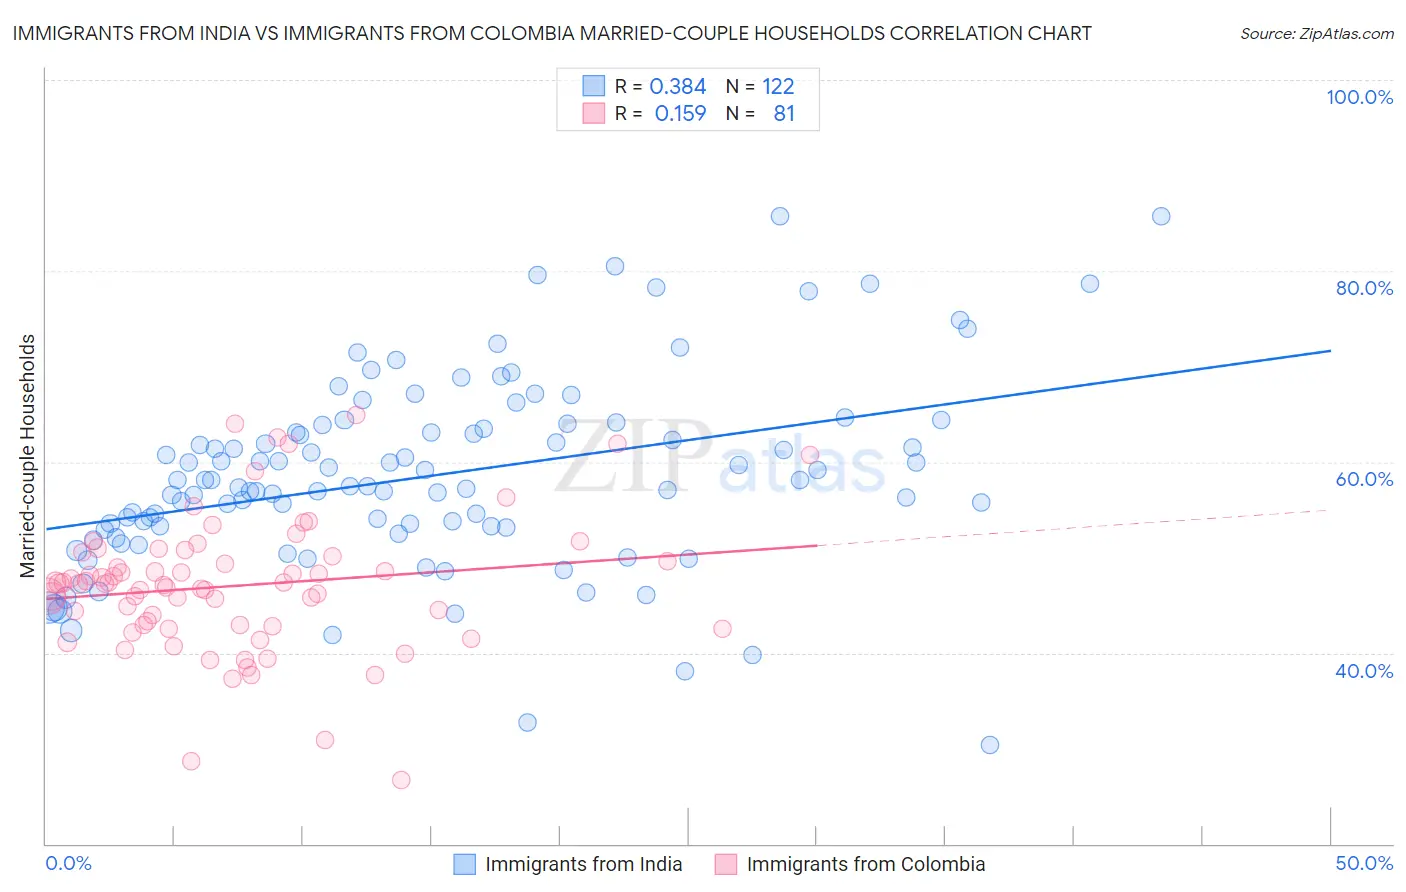
Immigrants from India vs Immigrants from Colombia Married-couple Households Correlation Chart
The statistical analysis conducted on geographies consisting of 433,740,567 people shows a mild positive correlation between the proportion of Immigrants from India and percentage of married-couple family households in the United States with a correlation coefficient (R) of 0.384 and weighted average of 52.7%. Similarly, the statistical analysis conducted on geographies consisting of 378,499,712 people shows a poor positive correlation between the proportion of Immigrants from Colombia and percentage of married-couple family households in the United States with a correlation coefficient (R) of 0.159 and weighted average of 46.4%, a difference of 13.7%.
Married-couple Households Correlation Summary
| Measurement | Immigrants from India | Immigrants from Colombia |
| Minimum | 30.4% | 26.7% |
| Maximum | 85.7% | 64.9% |
| Range | 55.3% | 38.2% |
| Mean | 58.5% | 47.0% |
| Median | 57.4% | 47.3% |
| Interquartile 25% (IQ1) | 53.2% | 42.8% |
| Interquartile 75% (IQ3) | 63.5% | 50.4% |
| Interquartile Range (IQR) | 10.3% | 7.5% |
| Standard Deviation (Sample) | 10.0% | 7.1% |
| Standard Deviation (Population) | 10.0% | 7.1% |
Similar Demographics by Married-couple Households
Demographics Similar to Immigrants from India by Married-couple Households
In terms of married-couple households, the demographic groups most similar to Immigrants from India are Immigrants from Taiwan (52.4%, a difference of 0.61%), Thai (51.9%, a difference of 1.6%), Assyrian/Chaldean/Syriac (51.8%, a difference of 1.8%), Tongan (51.6%, a difference of 2.3%), and Danish (51.1%, a difference of 3.3%).
| Demographics | Rating | Rank | Married-couple Households |
| Immigrants | India | 100.0 /100 | #1 | Exceptional 52.7% |
| Immigrants | Taiwan | 100.0 /100 | #2 | Exceptional 52.4% |
| Thais | 100.0 /100 | #3 | Exceptional 51.9% |
| Assyrians/Chaldeans/Syriacs | 100.0 /100 | #4 | Exceptional 51.8% |
| Tongans | 100.0 /100 | #5 | Exceptional 51.6% |
| Danes | 100.0 /100 | #6 | Exceptional 51.1% |
| Filipinos | 100.0 /100 | #7 | Exceptional 51.0% |
| Immigrants | South Central Asia | 100.0 /100 | #8 | Exceptional 50.6% |
| Pennsylvania Germans | 100.0 /100 | #9 | Exceptional 50.4% |
| Chinese | 100.0 /100 | #10 | Exceptional 50.4% |
| Immigrants | Pakistan | 100.0 /100 | #11 | Exceptional 50.1% |
| Swiss | 100.0 /100 | #12 | Exceptional 49.9% |
| Immigrants | Korea | 100.0 /100 | #13 | Exceptional 49.9% |
| Burmese | 100.0 /100 | #14 | Exceptional 49.8% |
| Koreans | 99.9 /100 | #15 | Exceptional 49.7% |
Demographics Similar to Immigrants from Colombia by Married-couple Households
In terms of married-couple households, the demographic groups most similar to Immigrants from Colombia are Cajun (46.4%, a difference of 0.030%), Immigrants (46.3%, a difference of 0.090%), Immigrants from Costa Rica (46.3%, a difference of 0.10%), Immigrants from Zimbabwe (46.3%, a difference of 0.12%), and Immigrants from Mexico (46.4%, a difference of 0.15%).
| Demographics | Rating | Rank | Married-couple Households |
| Israelis | 62.3 /100 | #168 | Good 46.7% |
| Spanish American Indians | 59.4 /100 | #169 | Average 46.6% |
| South Americans | 58.0 /100 | #170 | Average 46.6% |
| Immigrants | Chile | 55.7 /100 | #171 | Average 46.5% |
| Immigrants | Australia | 54.6 /100 | #172 | Average 46.5% |
| Immigrants | Norway | 52.0 /100 | #173 | Average 46.5% |
| Immigrants | Mexico | 50.0 /100 | #174 | Average 46.4% |
| Immigrants | Colombia | 46.1 /100 | #175 | Average 46.4% |
| Cajuns | 45.2 /100 | #176 | Average 46.4% |
| Immigrants | Immigrants | 43.8 /100 | #177 | Average 46.3% |
| Immigrants | Costa Rica | 43.4 /100 | #178 | Average 46.3% |
| Immigrants | Zimbabwe | 43.0 /100 | #179 | Average 46.3% |
| Mongolians | 42.0 /100 | #180 | Average 46.3% |
| Malaysians | 41.8 /100 | #181 | Average 46.3% |
| Yugoslavians | 38.9 /100 | #182 | Fair 46.2% |