Immigrants from Jordan vs Russian Married-couple Households
COMPARE
Immigrants from Jordan
Russian
Married-couple Households
Married-couple Households Comparison
Immigrants from Jordan
Russians
47.7%
MARRIED-COUPLE HOUSEHOLDS
94.1/ 100
METRIC RATING
109th/ 347
METRIC RANK
48.2%
MARRIED-COUPLE HOUSEHOLDS
98.1/ 100
METRIC RATING
80th/ 347
METRIC RANK
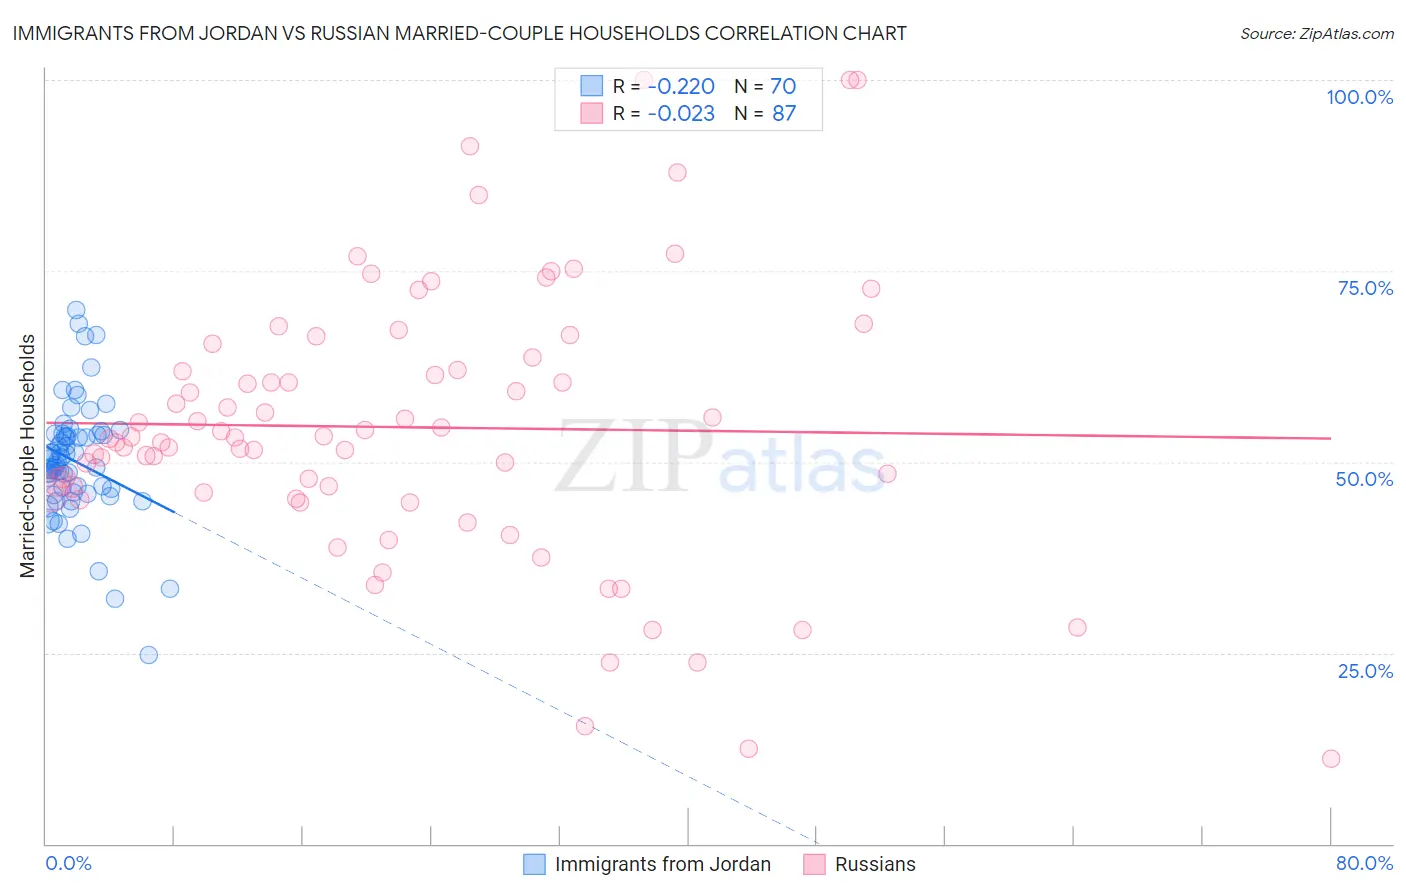
Immigrants from Jordan vs Russian Married-couple Households Correlation Chart
The statistical analysis conducted on geographies consisting of 181,252,999 people shows a weak negative correlation between the proportion of Immigrants from Jordan and percentage of married-couple family households in the United States with a correlation coefficient (R) of -0.220 and weighted average of 47.7%. Similarly, the statistical analysis conducted on geographies consisting of 511,711,387 people shows no correlation between the proportion of Russians and percentage of married-couple family households in the United States with a correlation coefficient (R) of -0.023 and weighted average of 48.2%, a difference of 1.1%.
Married-couple Households Correlation Summary
| Measurement | Immigrants from Jordan | Russian |
| Minimum | 24.7% | 11.1% |
| Maximum | 69.8% | 100.0% |
| Range | 45.1% | 88.9% |
| Mean | 50.1% | 54.5% |
| Median | 49.9% | 53.3% |
| Interquartile 25% (IQ1) | 46.0% | 45.9% |
| Interquartile 75% (IQ3) | 53.6% | 63.7% |
| Interquartile Range (IQR) | 7.5% | 17.8% |
| Standard Deviation (Sample) | 7.7% | 17.9% |
| Standard Deviation (Population) | 7.7% | 17.8% |
Similar Demographics by Married-couple Households
Demographics Similar to Immigrants from Jordan by Married-couple Households
In terms of married-couple households, the demographic groups most similar to Immigrants from Jordan are Macedonian (47.6%, a difference of 0.020%), Syrian (47.6%, a difference of 0.030%), Peruvian (47.6%, a difference of 0.040%), Immigrants from Japan (47.7%, a difference of 0.050%), and Venezuelan (47.6%, a difference of 0.050%).
| Demographics | Rating | Rank | Married-couple Households |
| Slavs | 96.0 /100 | #102 | Exceptional 47.8% |
| Hawaiians | 96.0 /100 | #103 | Exceptional 47.8% |
| Immigrants | South Africa | 96.0 /100 | #104 | Exceptional 47.8% |
| Immigrants | Czechoslovakia | 95.5 /100 | #105 | Exceptional 47.8% |
| Portuguese | 95.5 /100 | #106 | Exceptional 47.8% |
| Estonians | 94.7 /100 | #107 | Exceptional 47.7% |
| Immigrants | Japan | 94.4 /100 | #108 | Exceptional 47.7% |
| Immigrants | Jordan | 94.1 /100 | #109 | Exceptional 47.7% |
| Macedonians | 93.9 /100 | #110 | Exceptional 47.6% |
| Syrians | 93.9 /100 | #111 | Exceptional 47.6% |
| Peruvians | 93.8 /100 | #112 | Exceptional 47.6% |
| Venezuelans | 93.8 /100 | #113 | Exceptional 47.6% |
| Immigrants | Europe | 93.7 /100 | #114 | Exceptional 47.6% |
| Slovaks | 92.9 /100 | #115 | Exceptional 47.6% |
| Argentineans | 92.5 /100 | #116 | Exceptional 47.5% |
Demographics Similar to Russians by Married-couple Households
In terms of married-couple households, the demographic groups most similar to Russians are Immigrants from Netherlands (48.2%, a difference of 0.020%), Egyptian (48.2%, a difference of 0.030%), Canadian (48.2%, a difference of 0.050%), Finnish (48.1%, a difference of 0.060%), and Immigrants from England (48.2%, a difference of 0.15%).
| Demographics | Rating | Rank | Married-couple Households |
| Immigrants | Singapore | 98.6 /100 | #73 | Exceptional 48.3% |
| Immigrants | Romania | 98.6 /100 | #74 | Exceptional 48.3% |
| Immigrants | England | 98.4 /100 | #75 | Exceptional 48.2% |
| Immigrants | Fiji | 98.4 /100 | #76 | Exceptional 48.2% |
| Canadians | 98.2 /100 | #77 | Exceptional 48.2% |
| Egyptians | 98.2 /100 | #78 | Exceptional 48.2% |
| Immigrants | Netherlands | 98.2 /100 | #79 | Exceptional 48.2% |
| Russians | 98.1 /100 | #80 | Exceptional 48.2% |
| Finns | 98.0 /100 | #81 | Exceptional 48.1% |
| Immigrants | Poland | 97.7 /100 | #82 | Exceptional 48.1% |
| Guamanians/Chamorros | 97.6 /100 | #83 | Exceptional 48.1% |
| Ukrainians | 97.6 /100 | #84 | Exceptional 48.1% |
| Immigrants | Israel | 97.4 /100 | #85 | Exceptional 48.0% |
| Belgians | 97.4 /100 | #86 | Exceptional 48.0% |
| Immigrants | Ireland | 97.3 /100 | #87 | Exceptional 48.0% |