Immigrants from Jordan vs Russian 2 or more Vehicles in Household
COMPARE
Immigrants from Jordan
Russian
2 or more Vehicles in Household
2 or more Vehicles in Household Comparison
Immigrants from Jordan
Russians
57.2%
2 OR MORE VEHICLES IN HOUSEHOLD
96.6/ 100
METRIC RATING
116th/ 347
METRIC RANK
54.8%
2 OR MORE VEHICLES IN HOUSEHOLD
26.3/ 100
METRIC RATING
190th/ 347
METRIC RANK
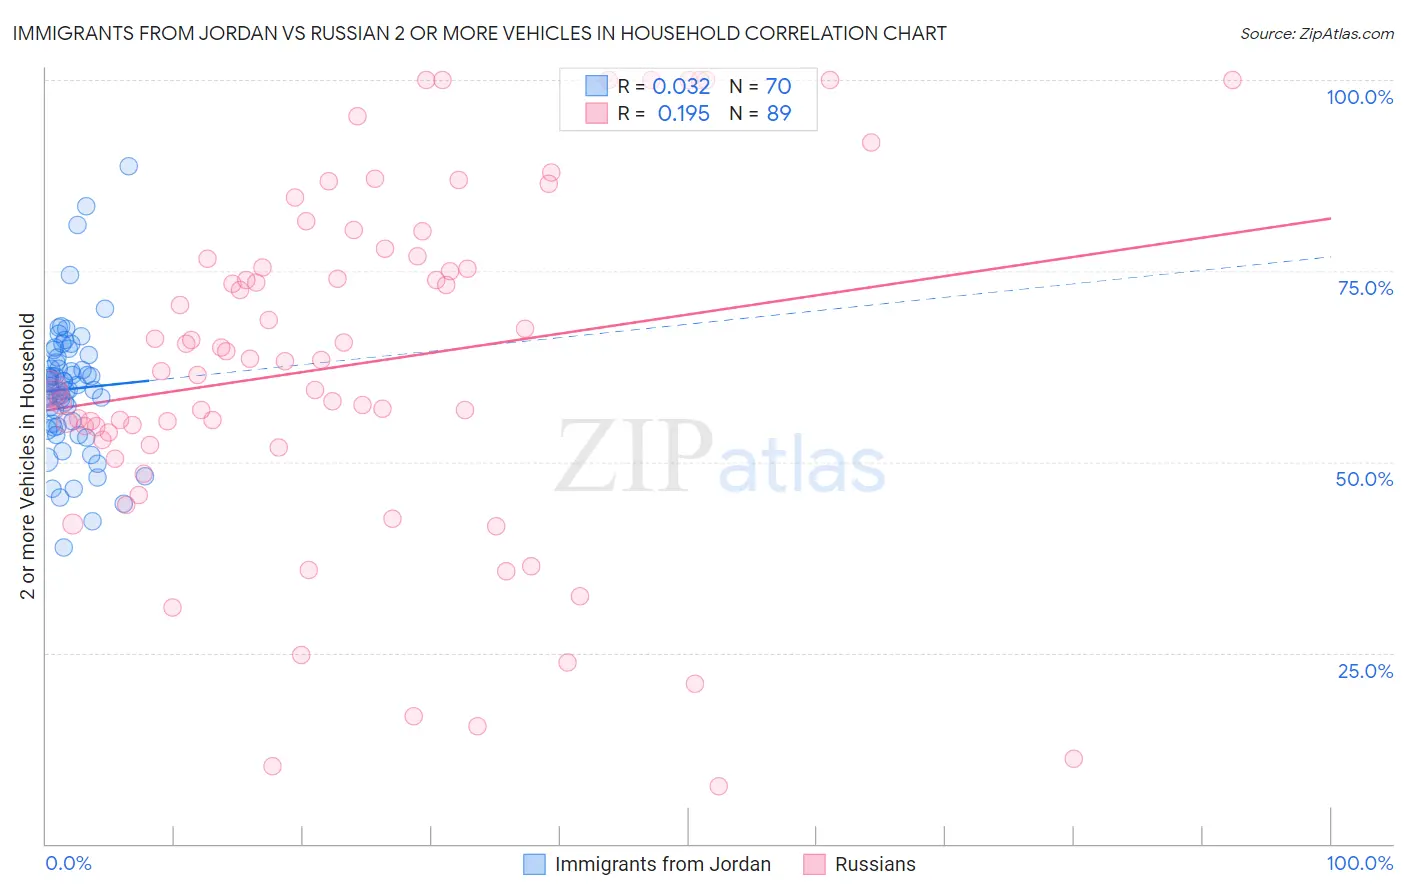
Immigrants from Jordan vs Russian 2 or more Vehicles in Household Correlation Chart
The statistical analysis conducted on geographies consisting of 181,252,999 people shows no correlation between the proportion of Immigrants from Jordan and percentage of households with 2 or more vehicles available in the United States with a correlation coefficient (R) of 0.032 and weighted average of 57.2%. Similarly, the statistical analysis conducted on geographies consisting of 511,789,622 people shows a poor positive correlation between the proportion of Russians and percentage of households with 2 or more vehicles available in the United States with a correlation coefficient (R) of 0.195 and weighted average of 54.8%, a difference of 4.4%.
2 or more Vehicles in Household Correlation Summary
| Measurement | Immigrants from Jordan | Russian |
| Minimum | 38.9% | 7.6% |
| Maximum | 88.8% | 100.0% |
| Range | 49.9% | 92.4% |
| Mean | 59.5% | 62.7% |
| Median | 59.7% | 63.1% |
| Interquartile 25% (IQ1) | 54.7% | 52.5% |
| Interquartile 75% (IQ3) | 63.6% | 76.7% |
| Interquartile Range (IQR) | 8.9% | 24.2% |
| Standard Deviation (Sample) | 8.6% | 22.8% |
| Standard Deviation (Population) | 8.6% | 22.7% |
Similar Demographics by 2 or more Vehicles in Household
Demographics Similar to Immigrants from Jordan by 2 or more Vehicles in Household
In terms of 2 or more vehicles in household, the demographic groups most similar to Immigrants from Jordan are Chippewa (57.2%, a difference of 0.010%), Immigrants from Lebanon (57.2%, a difference of 0.070%), Zimbabwean (57.2%, a difference of 0.10%), Iraqi (57.1%, a difference of 0.19%), and Asian (57.0%, a difference of 0.36%).
| Demographics | Rating | Rank | 2 or more Vehicles in Household |
| Immigrants | North America | 98.1 /100 | #109 | Exceptional 57.5% |
| Japanese | 98.0 /100 | #110 | Exceptional 57.5% |
| Greeks | 98.0 /100 | #111 | Exceptional 57.5% |
| Pueblo | 98.0 /100 | #112 | Exceptional 57.5% |
| Zimbabweans | 96.9 /100 | #113 | Exceptional 57.2% |
| Immigrants | Lebanon | 96.8 /100 | #114 | Exceptional 57.2% |
| Chippewa | 96.6 /100 | #115 | Exceptional 57.2% |
| Immigrants | Jordan | 96.6 /100 | #116 | Exceptional 57.2% |
| Iraqis | 95.8 /100 | #117 | Exceptional 57.1% |
| Asians | 95.1 /100 | #118 | Exceptional 57.0% |
| Natives/Alaskans | 95.0 /100 | #119 | Exceptional 57.0% |
| Costa Ricans | 94.7 /100 | #120 | Exceptional 56.9% |
| Sioux | 93.8 /100 | #121 | Exceptional 56.8% |
| Immigrants | South Africa | 92.5 /100 | #122 | Exceptional 56.7% |
| Australians | 91.8 /100 | #123 | Exceptional 56.7% |
Demographics Similar to Russians by 2 or more Vehicles in Household
In terms of 2 or more vehicles in household, the demographic groups most similar to Russians are Eastern European (54.8%, a difference of 0.060%), Immigrants (54.7%, a difference of 0.070%), Immigrants from Romania (54.7%, a difference of 0.13%), Immigrants from Japan (54.7%, a difference of 0.16%), and Central American (54.7%, a difference of 0.18%).
| Demographics | Rating | Rank | 2 or more Vehicles in Household |
| Immigrants | Cameroon | 37.3 /100 | #183 | Fair 55.1% |
| Apache | 36.7 /100 | #184 | Fair 55.1% |
| Arabs | 35.9 /100 | #185 | Fair 55.0% |
| Peruvians | 33.7 /100 | #186 | Fair 55.0% |
| Immigrants | Uganda | 33.4 /100 | #187 | Fair 55.0% |
| Marshallese | 30.5 /100 | #188 | Fair 54.9% |
| Eastern Europeans | 27.5 /100 | #189 | Fair 54.8% |
| Russians | 26.3 /100 | #190 | Fair 54.8% |
| Immigrants | Immigrants | 25.0 /100 | #191 | Fair 54.7% |
| Immigrants | Romania | 23.8 /100 | #192 | Fair 54.7% |
| Immigrants | Japan | 23.4 /100 | #193 | Fair 54.7% |
| Central Americans | 23.0 /100 | #194 | Fair 54.7% |
| Iroquois | 22.6 /100 | #195 | Fair 54.7% |
| Immigrants | Poland | 19.3 /100 | #196 | Poor 54.6% |
| Argentineans | 17.5 /100 | #197 | Poor 54.5% |