Immigrants from Italy vs Shoshone Currently Married
COMPARE
Immigrants from Italy
Shoshone
Currently Married
Currently Married Comparison
Immigrants from Italy
Shoshone
47.7%
CURRENTLY MARRIED
92.9/ 100
METRIC RATING
107th/ 347
METRIC RANK
44.0%
CURRENTLY MARRIED
0.2/ 100
METRIC RATING
256th/ 347
METRIC RANK
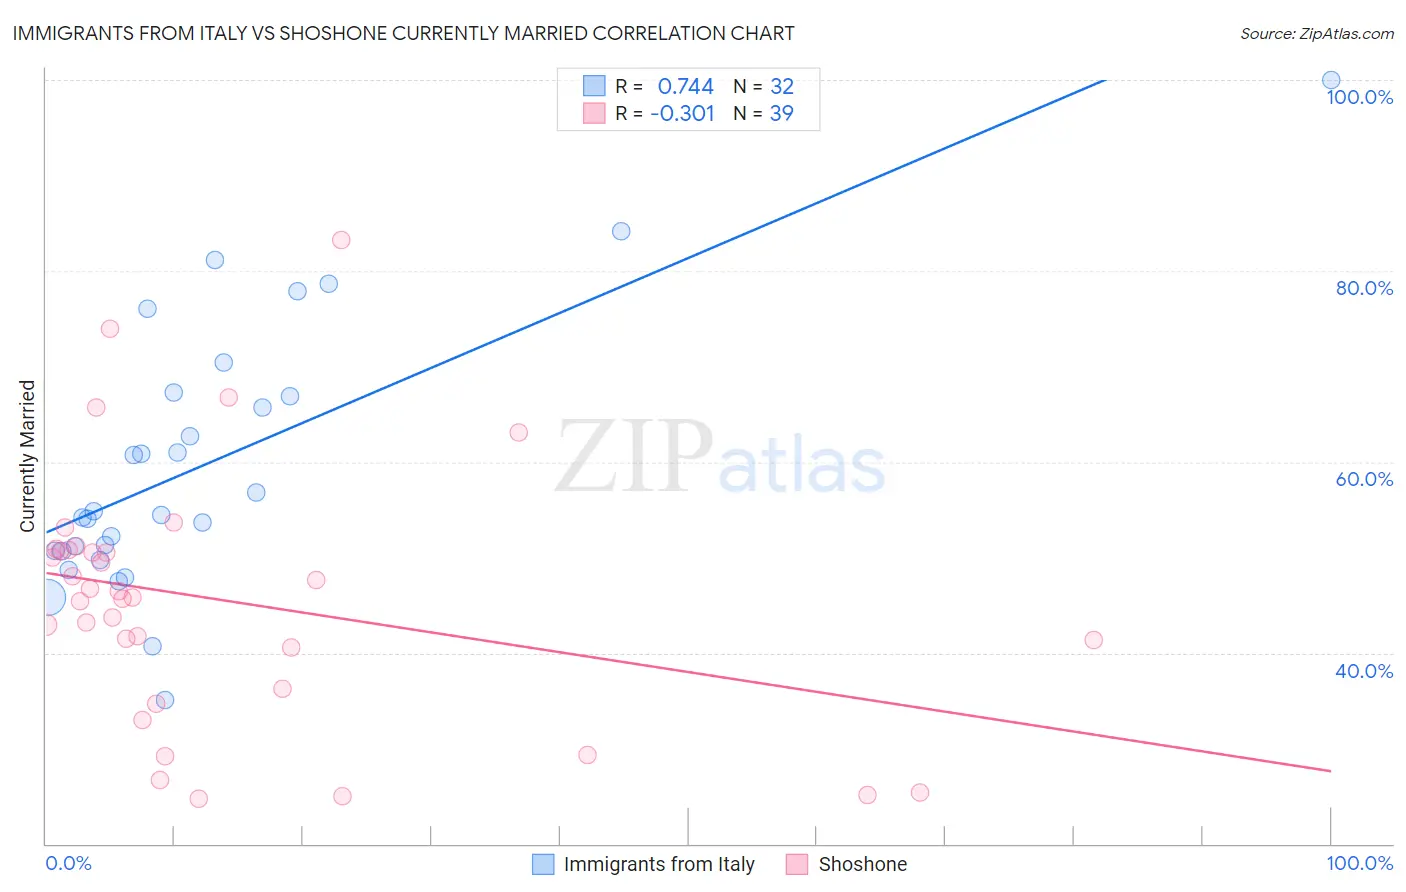
Immigrants from Italy vs Shoshone Currently Married Correlation Chart
The statistical analysis conducted on geographies consisting of 324,201,882 people shows a strong positive correlation between the proportion of Immigrants from Italy and percentage of population currently married in the United States with a correlation coefficient (R) of 0.744 and weighted average of 47.7%. Similarly, the statistical analysis conducted on geographies consisting of 66,627,152 people shows a mild negative correlation between the proportion of Shoshone and percentage of population currently married in the United States with a correlation coefficient (R) of -0.301 and weighted average of 44.0%, a difference of 8.5%.
Currently Married Correlation Summary
| Measurement | Immigrants from Italy | Shoshone |
| Minimum | 35.0% | 24.7% |
| Maximum | 100.0% | 83.3% |
| Range | 65.0% | 58.6% |
| Mean | 59.8% | 45.5% |
| Median | 54.7% | 45.8% |
| Interquartile 25% (IQ1) | 50.7% | 36.3% |
| Interquartile 75% (IQ3) | 67.1% | 50.8% |
| Interquartile Range (IQR) | 16.4% | 14.5% |
| Standard Deviation (Sample) | 14.0% | 13.3% |
| Standard Deviation (Population) | 13.8% | 13.2% |
Similar Demographics by Currently Married
Demographics Similar to Immigrants from Italy by Currently Married
In terms of currently married, the demographic groups most similar to Immigrants from Italy are Immigrants from Greece (47.7%, a difference of 0.030%), Immigrants from Singapore (47.8%, a difference of 0.060%), Tsimshian (47.7%, a difference of 0.060%), Immigrants from Egypt (47.7%, a difference of 0.080%), and Serbian (47.8%, a difference of 0.11%).
| Demographics | Rating | Rank | Currently Married |
| Celtics | 94.2 /100 | #100 | Exceptional 47.8% |
| Immigrants | Germany | 94.1 /100 | #101 | Exceptional 47.8% |
| Turks | 93.9 /100 | #102 | Exceptional 47.8% |
| Cypriots | 93.7 /100 | #103 | Exceptional 47.8% |
| Serbians | 93.6 /100 | #104 | Exceptional 47.8% |
| Immigrants | Singapore | 93.3 /100 | #105 | Exceptional 47.8% |
| Immigrants | Greece | 93.1 /100 | #106 | Exceptional 47.7% |
| Immigrants | Italy | 92.9 /100 | #107 | Exceptional 47.7% |
| Tsimshian | 92.4 /100 | #108 | Exceptional 47.7% |
| Immigrants | Egypt | 92.3 /100 | #109 | Exceptional 47.7% |
| Immigrants | Russia | 92.0 /100 | #110 | Exceptional 47.7% |
| Immigrants | Hungary | 91.2 /100 | #111 | Exceptional 47.6% |
| Immigrants | Western Europe | 91.1 /100 | #112 | Exceptional 47.6% |
| Immigrants | Denmark | 90.9 /100 | #113 | Exceptional 47.6% |
| South Africans | 90.5 /100 | #114 | Exceptional 47.6% |
Demographics Similar to Shoshone by Currently Married
In terms of currently married, the demographic groups most similar to Shoshone are Yakama (44.0%, a difference of 0.050%), Vietnamese (44.0%, a difference of 0.12%), Immigrants from Africa (43.9%, a difference of 0.20%), Ute (43.9%, a difference of 0.21%), and Immigrants from Central America (44.1%, a difference of 0.37%).
| Demographics | Rating | Rank | Currently Married |
| Immigrants | Cameroon | 0.3 /100 | #249 | Tragic 44.2% |
| Immigrants | Eastern Africa | 0.3 /100 | #250 | Tragic 44.2% |
| Blackfeet | 0.3 /100 | #251 | Tragic 44.2% |
| Hispanics or Latinos | 0.3 /100 | #252 | Tragic 44.1% |
| Immigrants | Central America | 0.3 /100 | #253 | Tragic 44.1% |
| Vietnamese | 0.2 /100 | #254 | Tragic 44.0% |
| Yakama | 0.2 /100 | #255 | Tragic 44.0% |
| Shoshone | 0.2 /100 | #256 | Tragic 44.0% |
| Immigrants | Africa | 0.2 /100 | #257 | Tragic 43.9% |
| Ute | 0.2 /100 | #258 | Tragic 43.9% |
| Immigrants | Sierra Leone | 0.1 /100 | #259 | Tragic 43.8% |
| Immigrants | Latin America | 0.1 /100 | #260 | Tragic 43.8% |
| Immigrants | Nicaragua | 0.1 /100 | #261 | Tragic 43.7% |
| Bangladeshis | 0.1 /100 | #262 | Tragic 43.7% |
| Immigrants | Cuba | 0.1 /100 | #263 | Tragic 43.7% |