Immigrants from Italy vs Nepalese Currently Married
COMPARE
Immigrants from Italy
Nepalese
Currently Married
Currently Married Comparison
Immigrants from Italy
Nepalese
47.7%
CURRENTLY MARRIED
92.9/ 100
METRIC RATING
107th/ 347
METRIC RANK
44.7%
CURRENTLY MARRIED
1.2/ 100
METRIC RATING
232nd/ 347
METRIC RANK
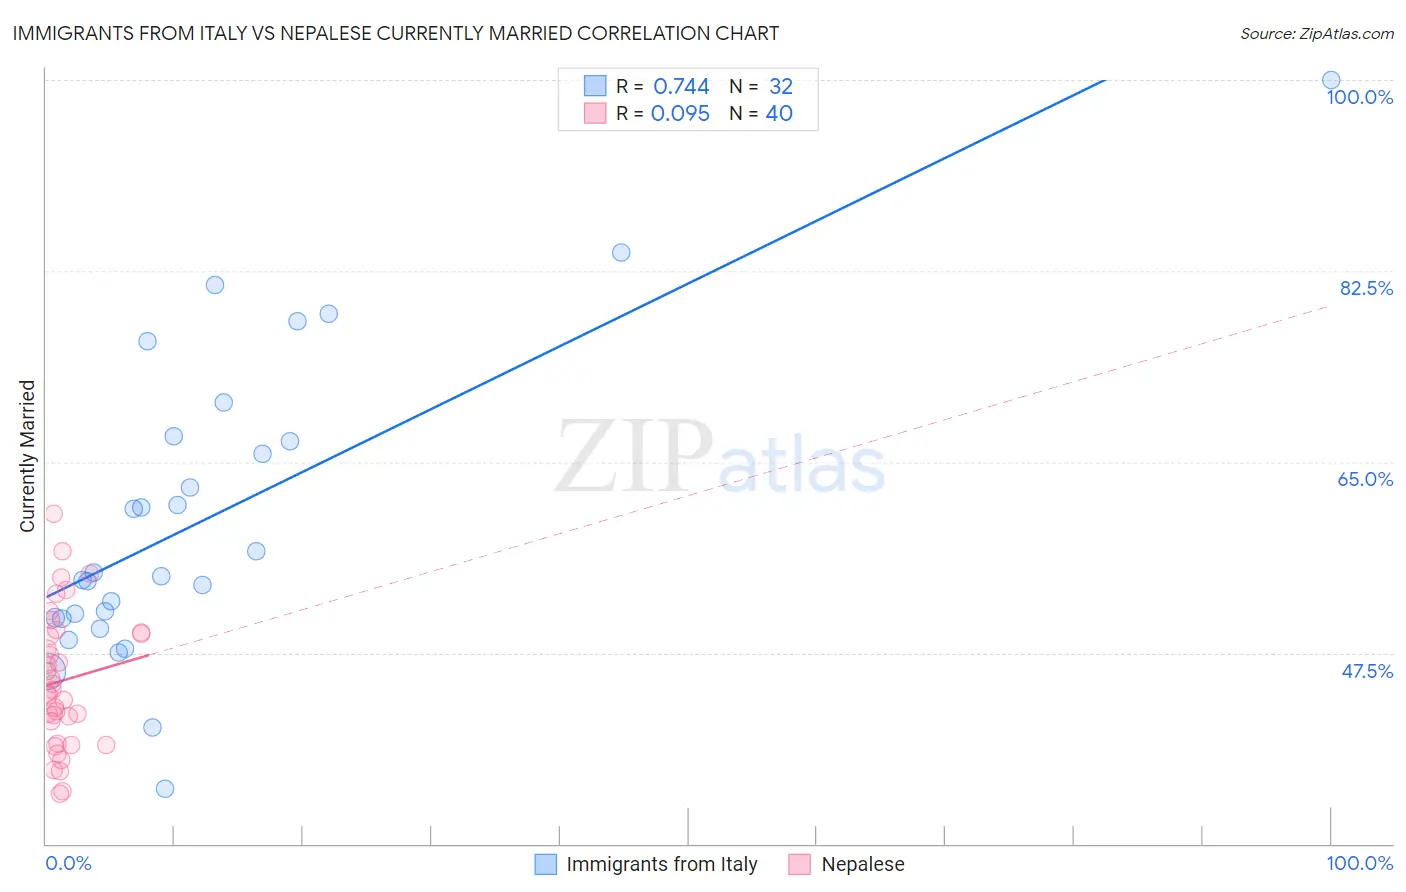
Immigrants from Italy vs Nepalese Currently Married Correlation Chart
The statistical analysis conducted on geographies consisting of 324,201,882 people shows a strong positive correlation between the proportion of Immigrants from Italy and percentage of population currently married in the United States with a correlation coefficient (R) of 0.744 and weighted average of 47.7%. Similarly, the statistical analysis conducted on geographies consisting of 24,521,755 people shows a slight positive correlation between the proportion of Nepalese and percentage of population currently married in the United States with a correlation coefficient (R) of 0.095 and weighted average of 44.7%, a difference of 6.7%.
Currently Married Correlation Summary
| Measurement | Immigrants from Italy | Nepalese |
| Minimum | 35.0% | 34.6% |
| Maximum | 100.0% | 60.3% |
| Range | 65.0% | 25.7% |
| Mean | 59.8% | 45.0% |
| Median | 54.7% | 44.0% |
| Interquartile 25% (IQ1) | 50.7% | 40.2% |
| Interquartile 75% (IQ3) | 67.1% | 49.3% |
| Interquartile Range (IQR) | 16.4% | 9.2% |
| Standard Deviation (Sample) | 14.0% | 6.2% |
| Standard Deviation (Population) | 13.8% | 6.2% |
Similar Demographics by Currently Married
Demographics Similar to Immigrants from Italy by Currently Married
In terms of currently married, the demographic groups most similar to Immigrants from Italy are Immigrants from Greece (47.7%, a difference of 0.030%), Immigrants from Singapore (47.8%, a difference of 0.060%), Tsimshian (47.7%, a difference of 0.060%), Immigrants from Egypt (47.7%, a difference of 0.080%), and Serbian (47.8%, a difference of 0.11%).
| Demographics | Rating | Rank | Currently Married |
| Celtics | 94.2 /100 | #100 | Exceptional 47.8% |
| Immigrants | Germany | 94.1 /100 | #101 | Exceptional 47.8% |
| Turks | 93.9 /100 | #102 | Exceptional 47.8% |
| Cypriots | 93.7 /100 | #103 | Exceptional 47.8% |
| Serbians | 93.6 /100 | #104 | Exceptional 47.8% |
| Immigrants | Singapore | 93.3 /100 | #105 | Exceptional 47.8% |
| Immigrants | Greece | 93.1 /100 | #106 | Exceptional 47.7% |
| Immigrants | Italy | 92.9 /100 | #107 | Exceptional 47.7% |
| Tsimshian | 92.4 /100 | #108 | Exceptional 47.7% |
| Immigrants | Egypt | 92.3 /100 | #109 | Exceptional 47.7% |
| Immigrants | Russia | 92.0 /100 | #110 | Exceptional 47.7% |
| Immigrants | Hungary | 91.2 /100 | #111 | Exceptional 47.6% |
| Immigrants | Western Europe | 91.1 /100 | #112 | Exceptional 47.6% |
| Immigrants | Denmark | 90.9 /100 | #113 | Exceptional 47.6% |
| South Africans | 90.5 /100 | #114 | Exceptional 47.6% |
Demographics Similar to Nepalese by Currently Married
In terms of currently married, the demographic groups most similar to Nepalese are Immigrants from Saudi Arabia (44.7%, a difference of 0.050%), Iroquois (44.7%, a difference of 0.060%), Alaskan Athabascan (44.6%, a difference of 0.21%), Cuban (44.6%, a difference of 0.22%), and Seminole (44.6%, a difference of 0.23%).
| Demographics | Rating | Rank | Currently Married |
| French American Indians | 2.2 /100 | #225 | Tragic 45.0% |
| Comanche | 2.1 /100 | #226 | Tragic 45.0% |
| Spanish Americans | 2.1 /100 | #227 | Tragic 45.0% |
| Immigrants | Uruguay | 2.0 /100 | #228 | Tragic 45.0% |
| Cree | 1.7 /100 | #229 | Tragic 44.9% |
| Immigrants | Kenya | 1.6 /100 | #230 | Tragic 44.9% |
| Immigrants | Panama | 1.5 /100 | #231 | Tragic 44.9% |
| Nepalese | 1.2 /100 | #232 | Tragic 44.7% |
| Immigrants | Saudi Arabia | 1.1 /100 | #233 | Tragic 44.7% |
| Iroquois | 1.1 /100 | #234 | Tragic 44.7% |
| Alaskan Athabascans | 0.9 /100 | #235 | Tragic 44.6% |
| Cubans | 0.9 /100 | #236 | Tragic 44.6% |
| Seminole | 0.9 /100 | #237 | Tragic 44.6% |
| Moroccans | 0.9 /100 | #238 | Tragic 44.6% |
| Immigrants | Mexico | 0.7 /100 | #239 | Tragic 44.5% |