Immigrants from Italy vs Cambodian Currently Married
COMPARE
Immigrants from Italy
Cambodian
Currently Married
Currently Married Comparison
Immigrants from Italy
Cambodians
47.7%
CURRENTLY MARRIED
92.9/ 100
METRIC RATING
107th/ 347
METRIC RANK
47.0%
CURRENTLY MARRIED
70.4/ 100
METRIC RATING
148th/ 347
METRIC RANK
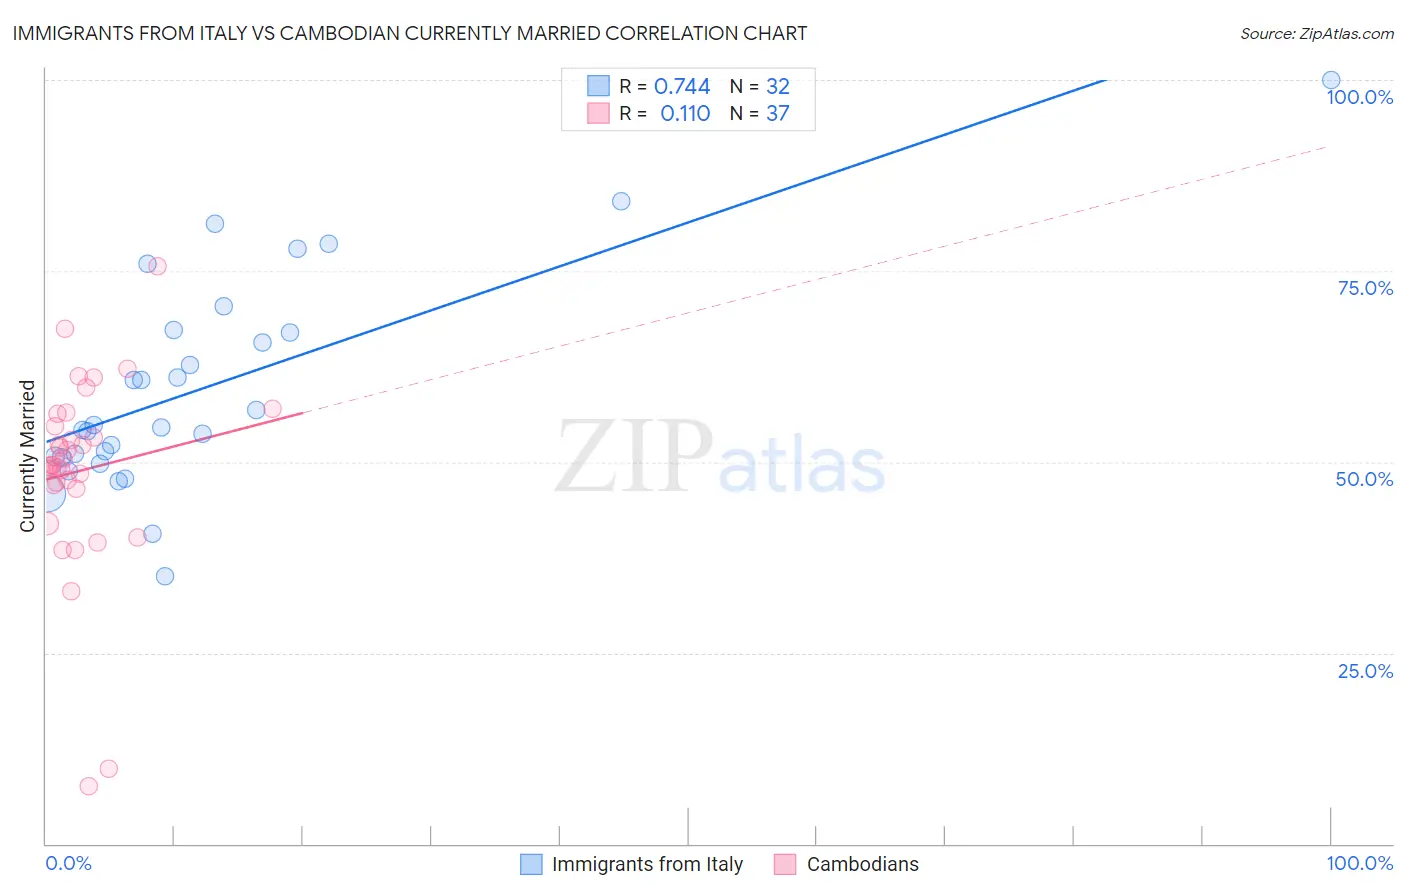
Immigrants from Italy vs Cambodian Currently Married Correlation Chart
The statistical analysis conducted on geographies consisting of 324,201,882 people shows a strong positive correlation between the proportion of Immigrants from Italy and percentage of population currently married in the United States with a correlation coefficient (R) of 0.744 and weighted average of 47.7%. Similarly, the statistical analysis conducted on geographies consisting of 102,515,172 people shows a poor positive correlation between the proportion of Cambodians and percentage of population currently married in the United States with a correlation coefficient (R) of 0.110 and weighted average of 47.0%, a difference of 1.5%.
Currently Married Correlation Summary
| Measurement | Immigrants from Italy | Cambodian |
| Minimum | 35.0% | 7.6% |
| Maximum | 100.0% | 75.6% |
| Range | 65.0% | 68.0% |
| Mean | 59.8% | 48.8% |
| Median | 54.7% | 49.5% |
| Interquartile 25% (IQ1) | 50.7% | 46.7% |
| Interquartile 75% (IQ3) | 67.1% | 55.5% |
| Interquartile Range (IQR) | 16.4% | 8.8% |
| Standard Deviation (Sample) | 14.0% | 12.8% |
| Standard Deviation (Population) | 13.8% | 12.6% |
Similar Demographics by Currently Married
Demographics Similar to Immigrants from Italy by Currently Married
In terms of currently married, the demographic groups most similar to Immigrants from Italy are Immigrants from Greece (47.7%, a difference of 0.030%), Immigrants from Singapore (47.8%, a difference of 0.060%), Tsimshian (47.7%, a difference of 0.060%), Immigrants from Egypt (47.7%, a difference of 0.080%), and Serbian (47.8%, a difference of 0.11%).
| Demographics | Rating | Rank | Currently Married |
| Celtics | 94.2 /100 | #100 | Exceptional 47.8% |
| Immigrants | Germany | 94.1 /100 | #101 | Exceptional 47.8% |
| Turks | 93.9 /100 | #102 | Exceptional 47.8% |
| Cypriots | 93.7 /100 | #103 | Exceptional 47.8% |
| Serbians | 93.6 /100 | #104 | Exceptional 47.8% |
| Immigrants | Singapore | 93.3 /100 | #105 | Exceptional 47.8% |
| Immigrants | Greece | 93.1 /100 | #106 | Exceptional 47.7% |
| Immigrants | Italy | 92.9 /100 | #107 | Exceptional 47.7% |
| Tsimshian | 92.4 /100 | #108 | Exceptional 47.7% |
| Immigrants | Egypt | 92.3 /100 | #109 | Exceptional 47.7% |
| Immigrants | Russia | 92.0 /100 | #110 | Exceptional 47.7% |
| Immigrants | Hungary | 91.2 /100 | #111 | Exceptional 47.6% |
| Immigrants | Western Europe | 91.1 /100 | #112 | Exceptional 47.6% |
| Immigrants | Denmark | 90.9 /100 | #113 | Exceptional 47.6% |
| South Africans | 90.5 /100 | #114 | Exceptional 47.6% |
Demographics Similar to Cambodians by Currently Married
In terms of currently married, the demographic groups most similar to Cambodians are Zimbabwean (47.0%, a difference of 0.010%), Immigrants from Turkey (47.0%, a difference of 0.010%), Chilean (47.0%, a difference of 0.030%), Immigrants from Argentina (47.0%, a difference of 0.070%), and Immigrants from Serbia (47.0%, a difference of 0.070%).
| Demographics | Rating | Rank | Currently Married |
| Venezuelans | 74.4 /100 | #141 | Good 47.1% |
| Argentineans | 74.4 /100 | #142 | Good 47.1% |
| Guamanians/Chamorros | 74.2 /100 | #143 | Good 47.1% |
| Hmong | 73.4 /100 | #144 | Good 47.1% |
| Immigrants | South Eastern Asia | 72.9 /100 | #145 | Good 47.1% |
| Carpatho Rusyns | 72.6 /100 | #146 | Good 47.0% |
| Immigrants | Argentina | 72.0 /100 | #147 | Good 47.0% |
| Cambodians | 70.4 /100 | #148 | Good 47.0% |
| Zimbabweans | 70.1 /100 | #149 | Good 47.0% |
| Immigrants | Turkey | 70.0 /100 | #150 | Good 47.0% |
| Chileans | 69.8 /100 | #151 | Good 47.0% |
| Immigrants | Serbia | 68.8 /100 | #152 | Good 47.0% |
| Immigrants | Venezuela | 68.6 /100 | #153 | Good 47.0% |
| Albanians | 68.6 /100 | #154 | Good 47.0% |
| Arabs | 68.6 /100 | #155 | Good 47.0% |