Immigrants from Guatemala vs Immigrants from Sweden Married-couple Households
COMPARE
Immigrants from Guatemala
Immigrants from Sweden
Married-couple Households
Married-couple Households Comparison
Immigrants from Guatemala
Immigrants from Sweden
42.8%
MARRIED-COUPLE HOUSEHOLDS
0.0/ 100
METRIC RATING
281st/ 347
METRIC RANK
47.2%
MARRIED-COUPLE HOUSEHOLDS
84.7/ 100
METRIC RATING
139th/ 347
METRIC RANK
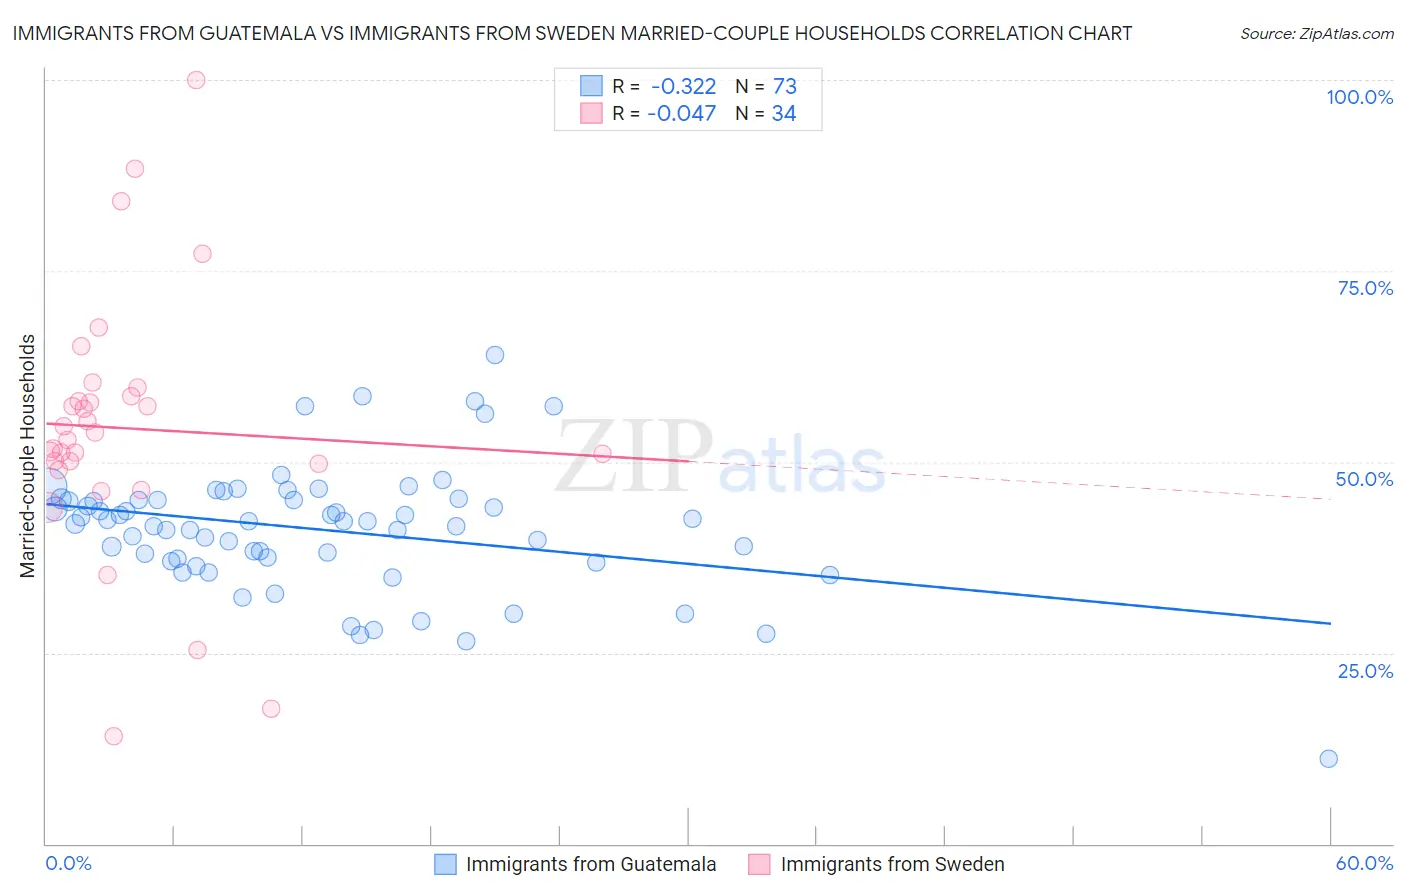
Immigrants from Guatemala vs Immigrants from Sweden Married-couple Households Correlation Chart
The statistical analysis conducted on geographies consisting of 377,166,435 people shows a mild negative correlation between the proportion of Immigrants from Guatemala and percentage of married-couple family households in the United States with a correlation coefficient (R) of -0.322 and weighted average of 42.8%. Similarly, the statistical analysis conducted on geographies consisting of 164,705,416 people shows no correlation between the proportion of Immigrants from Sweden and percentage of married-couple family households in the United States with a correlation coefficient (R) of -0.047 and weighted average of 47.2%, a difference of 10.2%.
Married-couple Households Correlation Summary
| Measurement | Immigrants from Guatemala | Immigrants from Sweden |
| Minimum | 11.2% | 14.1% |
| Maximum | 64.0% | 100.0% |
| Range | 52.8% | 85.9% |
| Mean | 41.1% | 54.4% |
| Median | 42.2% | 53.4% |
| Interquartile 25% (IQ1) | 37.2% | 49.7% |
| Interquartile 75% (IQ3) | 45.0% | 58.6% |
| Interquartile Range (IQR) | 7.9% | 8.9% |
| Standard Deviation (Sample) | 8.3% | 17.1% |
| Standard Deviation (Population) | 8.2% | 16.8% |
Similar Demographics by Married-couple Households
Demographics Similar to Immigrants from Guatemala by Married-couple Households
In terms of married-couple households, the demographic groups most similar to Immigrants from Guatemala are Immigrants from Ecuador (42.9%, a difference of 0.070%), Sierra Leonean (42.9%, a difference of 0.13%), Immigrants from Africa (42.9%, a difference of 0.16%), Immigrants from Eastern Africa (42.9%, a difference of 0.26%), and Immigrants from Ethiopia (43.1%, a difference of 0.52%).
| Demographics | Rating | Rank | Married-couple Households |
| Nigerians | 0.1 /100 | #274 | Tragic 43.2% |
| Immigrants | Bangladesh | 0.0 /100 | #275 | Tragic 43.1% |
| Immigrants | Ethiopia | 0.0 /100 | #276 | Tragic 43.1% |
| Immigrants | Eastern Africa | 0.0 /100 | #277 | Tragic 42.9% |
| Immigrants | Africa | 0.0 /100 | #278 | Tragic 42.9% |
| Sierra Leoneans | 0.0 /100 | #279 | Tragic 42.9% |
| Immigrants | Ecuador | 0.0 /100 | #280 | Tragic 42.9% |
| Immigrants | Guatemala | 0.0 /100 | #281 | Tragic 42.8% |
| Bermudans | 0.0 /100 | #282 | Tragic 42.4% |
| Inupiat | 0.0 /100 | #283 | Tragic 42.4% |
| Cheyenne | 0.0 /100 | #284 | Tragic 42.3% |
| Ghanaians | 0.0 /100 | #285 | Tragic 42.2% |
| Belizeans | 0.0 /100 | #286 | Tragic 42.2% |
| Chippewa | 0.0 /100 | #287 | Tragic 42.1% |
| Immigrants | Eritrea | 0.0 /100 | #288 | Tragic 42.1% |
Demographics Similar to Immigrants from Sweden by Married-couple Households
In terms of married-couple households, the demographic groups most similar to Immigrants from Sweden are Spanish (47.2%, a difference of 0.020%), Costa Rican (47.2%, a difference of 0.020%), Immigrants from Afghanistan (47.2%, a difference of 0.030%), New Zealander (47.2%, a difference of 0.040%), and Immigrants from Malaysia (47.2%, a difference of 0.040%).
| Demographics | Rating | Rank | Married-couple Households |
| Immigrants | Ukraine | 86.7 /100 | #132 | Excellent 47.3% |
| South Africans | 86.4 /100 | #133 | Excellent 47.3% |
| Immigrants | Greece | 86.0 /100 | #134 | Excellent 47.2% |
| Immigrants | Argentina | 86.0 /100 | #135 | Excellent 47.2% |
| New Zealanders | 85.3 /100 | #136 | Excellent 47.2% |
| Immigrants | Malaysia | 85.2 /100 | #137 | Excellent 47.2% |
| Immigrants | Afghanistan | 85.1 /100 | #138 | Excellent 47.2% |
| Immigrants | Sweden | 84.7 /100 | #139 | Excellent 47.2% |
| Spanish | 84.5 /100 | #140 | Excellent 47.2% |
| Costa Ricans | 84.4 /100 | #141 | Excellent 47.2% |
| Spaniards | 84.1 /100 | #142 | Excellent 47.2% |
| Immigrants | Belarus | 83.8 /100 | #143 | Excellent 47.2% |
| Mexicans | 83.4 /100 | #144 | Excellent 47.1% |
| Slovenes | 81.7 /100 | #145 | Excellent 47.1% |
| Immigrants | Western Europe | 81.6 /100 | #146 | Excellent 47.1% |