Immigrants from Guatemala vs Immigrants from Ireland Married-couple Households
COMPARE
Immigrants from Guatemala
Immigrants from Ireland
Married-couple Households
Married-couple Households Comparison
Immigrants from Guatemala
Immigrants from Ireland
42.8%
MARRIED-COUPLE HOUSEHOLDS
0.0/ 100
METRIC RATING
281st/ 347
METRIC RANK
48.0%
MARRIED-COUPLE HOUSEHOLDS
97.3/ 100
METRIC RATING
87th/ 347
METRIC RANK
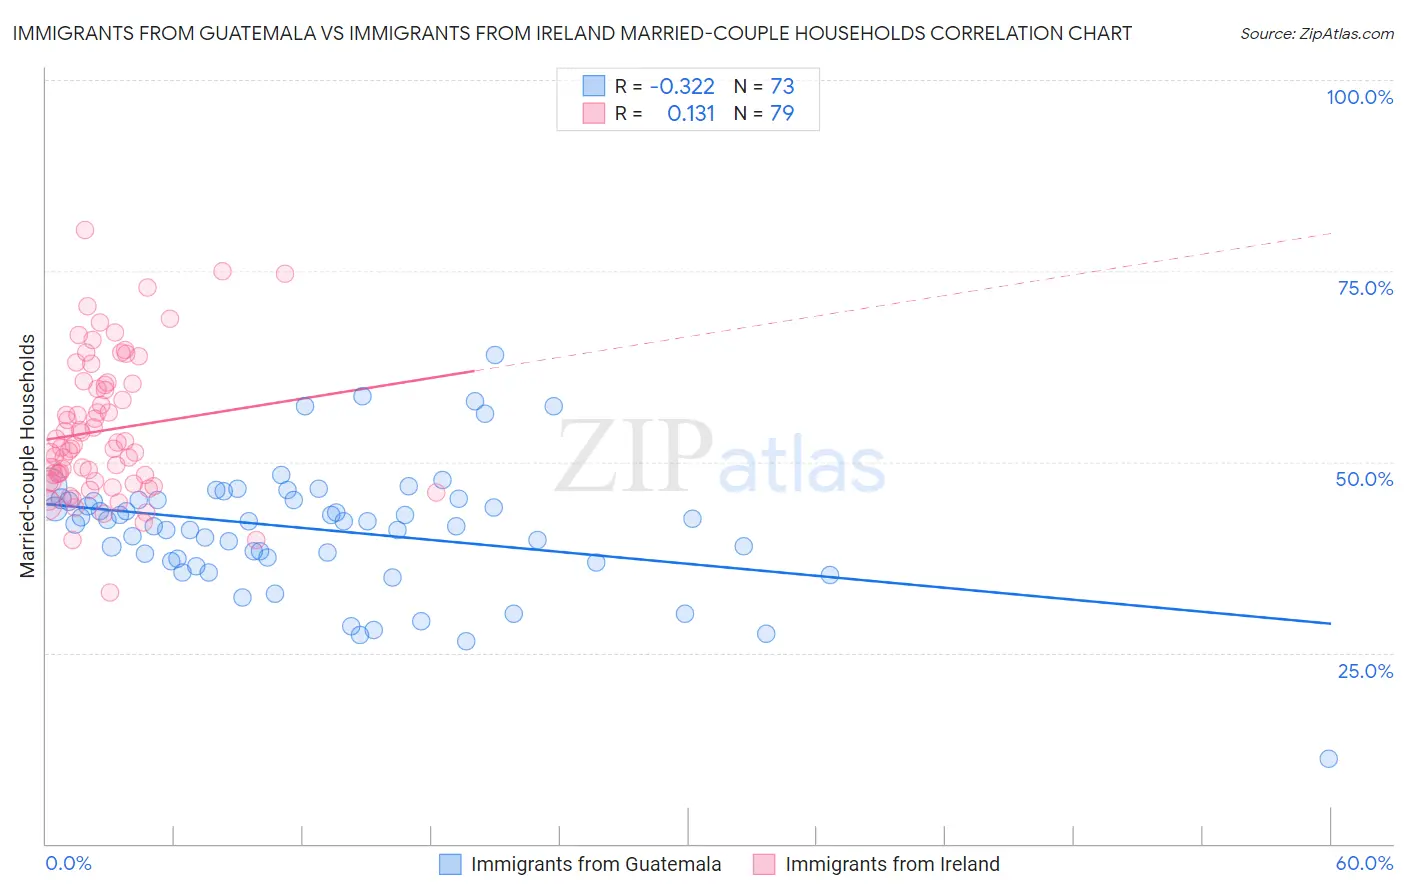
Immigrants from Guatemala vs Immigrants from Ireland Married-couple Households Correlation Chart
The statistical analysis conducted on geographies consisting of 377,166,435 people shows a mild negative correlation between the proportion of Immigrants from Guatemala and percentage of married-couple family households in the United States with a correlation coefficient (R) of -0.322 and weighted average of 42.8%. Similarly, the statistical analysis conducted on geographies consisting of 240,743,344 people shows a poor positive correlation between the proportion of Immigrants from Ireland and percentage of married-couple family households in the United States with a correlation coefficient (R) of 0.131 and weighted average of 48.0%, a difference of 12.1%.
Married-couple Households Correlation Summary
| Measurement | Immigrants from Guatemala | Immigrants from Ireland |
| Minimum | 11.2% | 32.8% |
| Maximum | 64.0% | 80.3% |
| Range | 52.8% | 47.5% |
| Mean | 41.1% | 54.1% |
| Median | 42.2% | 51.9% |
| Interquartile 25% (IQ1) | 37.2% | 47.4% |
| Interquartile 75% (IQ3) | 45.0% | 60.2% |
| Interquartile Range (IQR) | 7.9% | 12.8% |
| Standard Deviation (Sample) | 8.3% | 9.2% |
| Standard Deviation (Population) | 8.2% | 9.1% |
Similar Demographics by Married-couple Households
Demographics Similar to Immigrants from Guatemala by Married-couple Households
In terms of married-couple households, the demographic groups most similar to Immigrants from Guatemala are Immigrants from Ecuador (42.9%, a difference of 0.070%), Sierra Leonean (42.9%, a difference of 0.13%), Immigrants from Africa (42.9%, a difference of 0.16%), Immigrants from Eastern Africa (42.9%, a difference of 0.26%), and Immigrants from Ethiopia (43.1%, a difference of 0.52%).
| Demographics | Rating | Rank | Married-couple Households |
| Nigerians | 0.1 /100 | #274 | Tragic 43.2% |
| Immigrants | Bangladesh | 0.0 /100 | #275 | Tragic 43.1% |
| Immigrants | Ethiopia | 0.0 /100 | #276 | Tragic 43.1% |
| Immigrants | Eastern Africa | 0.0 /100 | #277 | Tragic 42.9% |
| Immigrants | Africa | 0.0 /100 | #278 | Tragic 42.9% |
| Sierra Leoneans | 0.0 /100 | #279 | Tragic 42.9% |
| Immigrants | Ecuador | 0.0 /100 | #280 | Tragic 42.9% |
| Immigrants | Guatemala | 0.0 /100 | #281 | Tragic 42.8% |
| Bermudans | 0.0 /100 | #282 | Tragic 42.4% |
| Inupiat | 0.0 /100 | #283 | Tragic 42.4% |
| Cheyenne | 0.0 /100 | #284 | Tragic 42.3% |
| Ghanaians | 0.0 /100 | #285 | Tragic 42.2% |
| Belizeans | 0.0 /100 | #286 | Tragic 42.2% |
| Chippewa | 0.0 /100 | #287 | Tragic 42.1% |
| Immigrants | Eritrea | 0.0 /100 | #288 | Tragic 42.1% |
Demographics Similar to Immigrants from Ireland by Married-couple Households
In terms of married-couple households, the demographic groups most similar to Immigrants from Ireland are Afghan (48.0%, a difference of 0.0%), Belgian (48.0%, a difference of 0.010%), Cypriot (48.0%, a difference of 0.030%), Immigrants from Israel (48.0%, a difference of 0.040%), and French (48.0%, a difference of 0.050%).
| Demographics | Rating | Rank | Married-couple Households |
| Russians | 98.1 /100 | #80 | Exceptional 48.2% |
| Finns | 98.0 /100 | #81 | Exceptional 48.1% |
| Immigrants | Poland | 97.7 /100 | #82 | Exceptional 48.1% |
| Guamanians/Chamorros | 97.6 /100 | #83 | Exceptional 48.1% |
| Ukrainians | 97.6 /100 | #84 | Exceptional 48.1% |
| Immigrants | Israel | 97.4 /100 | #85 | Exceptional 48.0% |
| Belgians | 97.4 /100 | #86 | Exceptional 48.0% |
| Immigrants | Ireland | 97.3 /100 | #87 | Exceptional 48.0% |
| Afghans | 97.3 /100 | #88 | Exceptional 48.0% |
| Cypriots | 97.2 /100 | #89 | Exceptional 48.0% |
| French | 97.2 /100 | #90 | Exceptional 48.0% |
| Immigrants | Moldova | 97.0 /100 | #91 | Exceptional 48.0% |
| Palestinians | 96.9 /100 | #92 | Exceptional 48.0% |
| Lebanese | 96.9 /100 | #93 | Exceptional 47.9% |
| Americans | 96.9 /100 | #94 | Exceptional 47.9% |