Immigrants from Grenada vs Houma Births to Unmarried Women
COMPARE
Immigrants from Grenada
Houma
Births to Unmarried Women
Births to Unmarried Women Comparison
Immigrants from Grenada
Houma
36.3%
BIRTHS TO UNMARRIED WOMEN
0.2/ 100
METRIC RATING
257th/ 347
METRIC RANK
46.6%
BIRTHS TO UNMARRIED WOMEN
0.0/ 100
METRIC RATING
337th/ 347
METRIC RANK
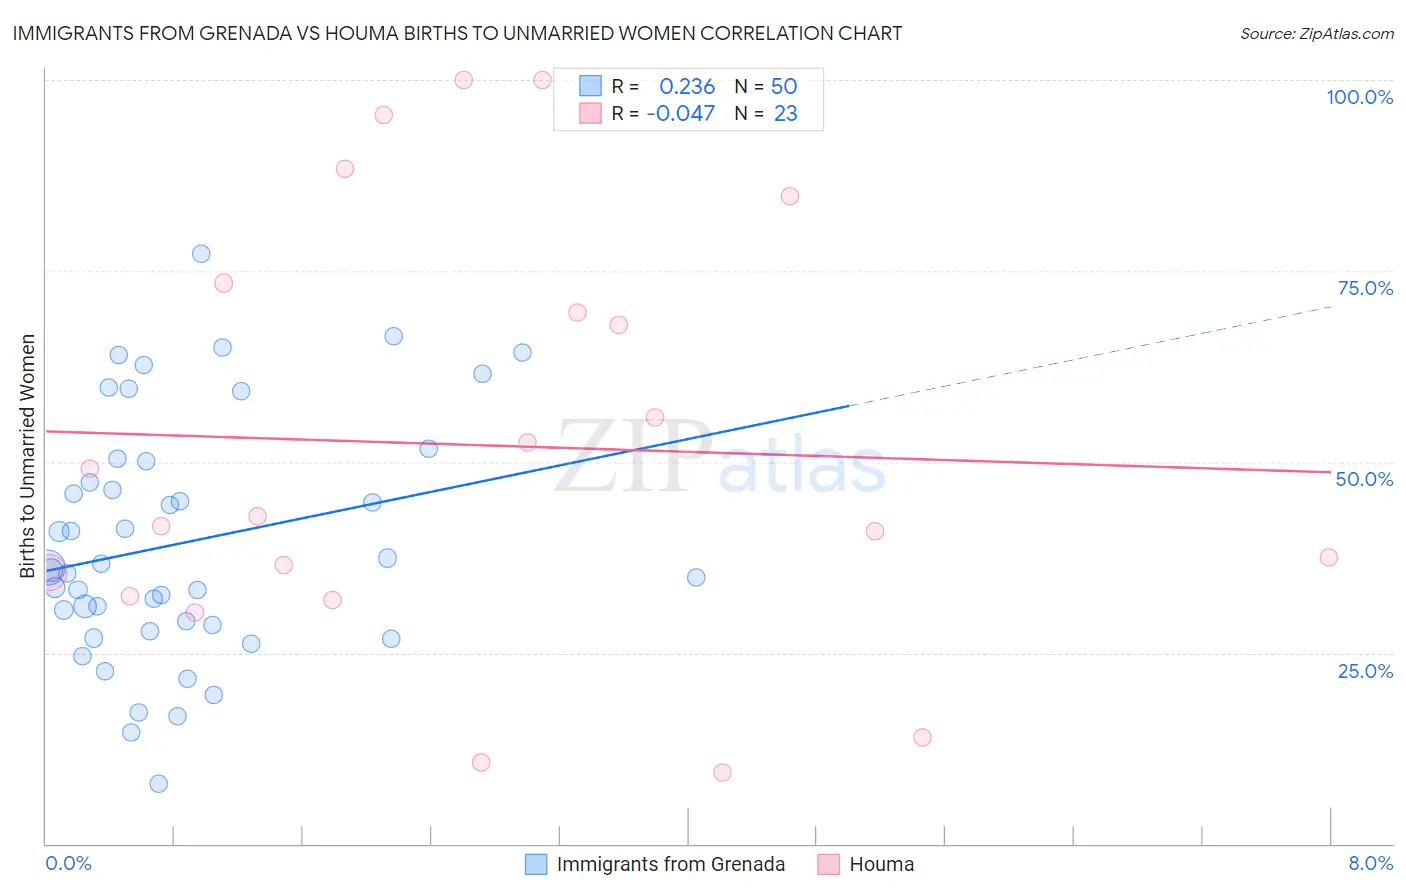
Immigrants from Grenada vs Houma Births to Unmarried Women Correlation Chart
The statistical analysis conducted on geographies consisting of 66,381,769 people shows a weak positive correlation between the proportion of Immigrants from Grenada and percentage of births to unmarried women in the United States with a correlation coefficient (R) of 0.236 and weighted average of 36.3%. Similarly, the statistical analysis conducted on geographies consisting of 36,513,880 people shows no correlation between the proportion of Houma and percentage of births to unmarried women in the United States with a correlation coefficient (R) of -0.047 and weighted average of 46.6%, a difference of 28.2%.
Births to Unmarried Women Correlation Summary
| Measurement | Immigrants from Grenada | Houma |
| Minimum | 7.9% | 9.3% |
| Maximum | 77.2% | 100.0% |
| Range | 69.3% | 90.7% |
| Mean | 39.4% | 52.2% |
| Median | 36.0% | 42.9% |
| Interquartile 25% (IQ1) | 28.6% | 32.4% |
| Interquartile 75% (IQ3) | 50.1% | 73.4% |
| Interquartile Range (IQR) | 21.5% | 41.0% |
| Standard Deviation (Sample) | 15.7% | 28.0% |
| Standard Deviation (Population) | 15.6% | 27.3% |
Similar Demographics by Births to Unmarried Women
Demographics Similar to Immigrants from Grenada by Births to Unmarried Women
In terms of births to unmarried women, the demographic groups most similar to Immigrants from Grenada are Chickasaw (36.3%, a difference of 0.030%), Immigrants from Trinidad and Tobago (36.3%, a difference of 0.030%), Potawatomi (36.2%, a difference of 0.16%), American (36.4%, a difference of 0.28%), and Immigrants from El Salvador (36.4%, a difference of 0.33%).
| Demographics | Rating | Rank | Births to Unmarried Women |
| Mexican American Indians | 0.4 /100 | #250 | Tragic 35.7% |
| Immigrants | Western Africa | 0.3 /100 | #251 | Tragic 36.0% |
| Salvadorans | 0.3 /100 | #252 | Tragic 36.0% |
| Immigrants | Portugal | 0.2 /100 | #253 | Tragic 36.2% |
| Potawatomi | 0.2 /100 | #254 | Tragic 36.2% |
| Chickasaw | 0.2 /100 | #255 | Tragic 36.3% |
| Immigrants | Trinidad and Tobago | 0.2 /100 | #256 | Tragic 36.3% |
| Immigrants | Grenada | 0.2 /100 | #257 | Tragic 36.3% |
| Americans | 0.2 /100 | #258 | Tragic 36.4% |
| Immigrants | El Salvador | 0.2 /100 | #259 | Tragic 36.4% |
| Ottawa | 0.2 /100 | #260 | Tragic 36.5% |
| Trinidadians and Tobagonians | 0.2 /100 | #261 | Tragic 36.5% |
| French American Indians | 0.1 /100 | #262 | Tragic 36.6% |
| Nicaraguans | 0.1 /100 | #263 | Tragic 36.6% |
| Sub-Saharan Africans | 0.1 /100 | #264 | Tragic 36.7% |
Demographics Similar to Houma by Births to Unmarried Women
In terms of births to unmarried women, the demographic groups most similar to Houma are Arapaho (47.1%, a difference of 1.2%), Puerto Rican (45.7%, a difference of 1.9%), Colville (45.3%, a difference of 2.7%), Lumbee (48.2%, a difference of 3.5%), and Yuman (44.4%, a difference of 4.9%).
| Demographics | Rating | Rank | Births to Unmarried Women |
| Chippewa | 0.0 /100 | #330 | Tragic 42.6% |
| Natives/Alaskans | 0.0 /100 | #331 | Tragic 43.0% |
| Kiowa | 0.0 /100 | #332 | Tragic 43.1% |
| Blacks/African Americans | 0.0 /100 | #333 | Tragic 44.3% |
| Yuman | 0.0 /100 | #334 | Tragic 44.4% |
| Colville | 0.0 /100 | #335 | Tragic 45.3% |
| Puerto Ricans | 0.0 /100 | #336 | Tragic 45.7% |
| Houma | 0.0 /100 | #337 | Tragic 46.6% |
| Arapaho | 0.0 /100 | #338 | Tragic 47.1% |
| Lumbee | 0.0 /100 | #339 | Tragic 48.2% |
| Tohono O'odham | 0.0 /100 | #340 | Tragic 49.8% |
| Hopi | 0.0 /100 | #341 | Tragic 50.8% |
| Menominee | 0.0 /100 | #342 | Tragic 51.1% |
| Pima | 0.0 /100 | #343 | Tragic 51.5% |
| Navajo | 0.0 /100 | #344 | Tragic 51.5% |