British West Indian vs Houma Births to Unmarried Women
COMPARE
British West Indian
Houma
Births to Unmarried Women
Births to Unmarried Women Comparison
British West Indians
Houma
38.0%
BIRTHS TO UNMARRIED WOMEN
0.0/ 100
METRIC RATING
294th/ 347
METRIC RANK
46.6%
BIRTHS TO UNMARRIED WOMEN
0.0/ 100
METRIC RATING
337th/ 347
METRIC RANK
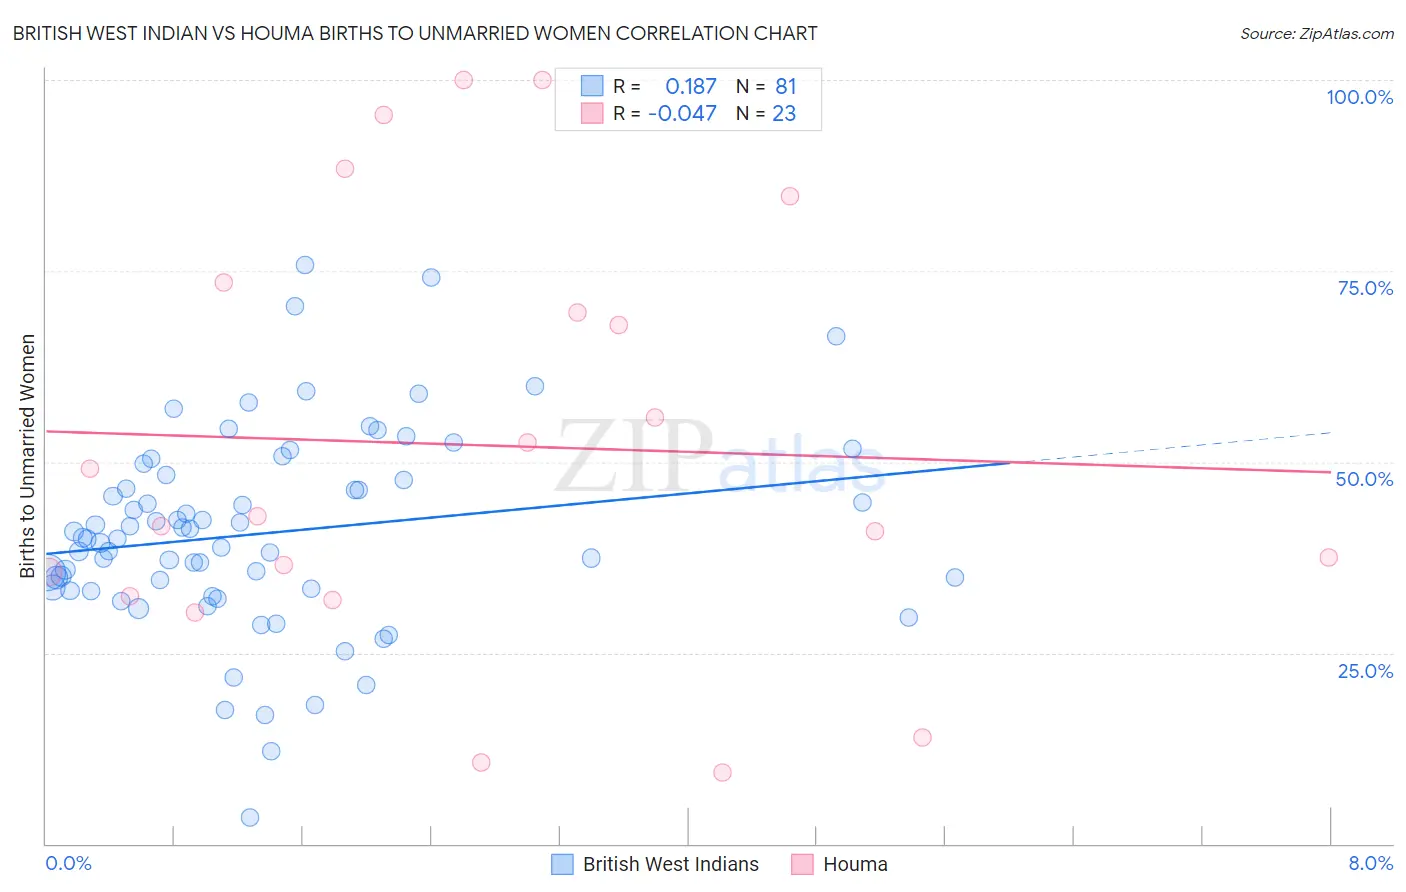
British West Indian vs Houma Births to Unmarried Women Correlation Chart
The statistical analysis conducted on geographies consisting of 148,832,690 people shows a poor positive correlation between the proportion of British West Indians and percentage of births to unmarried women in the United States with a correlation coefficient (R) of 0.187 and weighted average of 38.0%. Similarly, the statistical analysis conducted on geographies consisting of 36,513,880 people shows no correlation between the proportion of Houma and percentage of births to unmarried women in the United States with a correlation coefficient (R) of -0.047 and weighted average of 46.6%, a difference of 22.5%.
Births to Unmarried Women Correlation Summary
| Measurement | British West Indian | Houma |
| Minimum | 3.4% | 9.3% |
| Maximum | 75.8% | 100.0% |
| Range | 72.4% | 90.7% |
| Mean | 40.6% | 52.2% |
| Median | 39.9% | 42.9% |
| Interquartile 25% (IQ1) | 33.2% | 32.4% |
| Interquartile 75% (IQ3) | 48.0% | 73.4% |
| Interquartile Range (IQR) | 14.7% | 41.0% |
| Standard Deviation (Sample) | 13.1% | 28.0% |
| Standard Deviation (Population) | 13.0% | 27.3% |
Similar Demographics by Births to Unmarried Women
Demographics Similar to British West Indians by Births to Unmarried Women
In terms of births to unmarried women, the demographic groups most similar to British West Indians are Immigrants from Nicaragua (38.0%, a difference of 0.050%), Blackfeet (37.9%, a difference of 0.20%), Seminole (37.9%, a difference of 0.25%), Iroquois (38.2%, a difference of 0.55%), and Hispanic or Latino (37.8%, a difference of 0.59%).
| Demographics | Rating | Rank | Births to Unmarried Women |
| Creek | 0.0 /100 | #287 | Tragic 37.6% |
| Immigrants | Liberia | 0.0 /100 | #288 | Tragic 37.6% |
| Alaskan Athabascans | 0.0 /100 | #289 | Tragic 37.7% |
| Hispanics or Latinos | 0.0 /100 | #290 | Tragic 37.8% |
| Seminole | 0.0 /100 | #291 | Tragic 37.9% |
| Blackfeet | 0.0 /100 | #292 | Tragic 37.9% |
| Immigrants | Nicaragua | 0.0 /100 | #293 | Tragic 38.0% |
| British West Indians | 0.0 /100 | #294 | Tragic 38.0% |
| Iroquois | 0.0 /100 | #295 | Tragic 38.2% |
| Alaska Natives | 0.0 /100 | #296 | Tragic 38.3% |
| Dutch West Indians | 0.0 /100 | #297 | Tragic 38.4% |
| Jamaicans | 0.0 /100 | #298 | Tragic 38.5% |
| Spanish Americans | 0.0 /100 | #299 | Tragic 38.6% |
| Immigrants | West Indies | 0.0 /100 | #300 | Tragic 38.6% |
| Haitians | 0.0 /100 | #301 | Tragic 38.6% |
Demographics Similar to Houma by Births to Unmarried Women
In terms of births to unmarried women, the demographic groups most similar to Houma are Arapaho (47.1%, a difference of 1.2%), Puerto Rican (45.7%, a difference of 1.9%), Colville (45.3%, a difference of 2.7%), Lumbee (48.2%, a difference of 3.5%), and Yuman (44.4%, a difference of 4.9%).
| Demographics | Rating | Rank | Births to Unmarried Women |
| Chippewa | 0.0 /100 | #330 | Tragic 42.6% |
| Natives/Alaskans | 0.0 /100 | #331 | Tragic 43.0% |
| Kiowa | 0.0 /100 | #332 | Tragic 43.1% |
| Blacks/African Americans | 0.0 /100 | #333 | Tragic 44.3% |
| Yuman | 0.0 /100 | #334 | Tragic 44.4% |
| Colville | 0.0 /100 | #335 | Tragic 45.3% |
| Puerto Ricans | 0.0 /100 | #336 | Tragic 45.7% |
| Houma | 0.0 /100 | #337 | Tragic 46.6% |
| Arapaho | 0.0 /100 | #338 | Tragic 47.1% |
| Lumbee | 0.0 /100 | #339 | Tragic 48.2% |
| Tohono O'odham | 0.0 /100 | #340 | Tragic 49.8% |
| Hopi | 0.0 /100 | #341 | Tragic 50.8% |
| Menominee | 0.0 /100 | #342 | Tragic 51.1% |
| Pima | 0.0 /100 | #343 | Tragic 51.5% |
| Navajo | 0.0 /100 | #344 | Tragic 51.5% |