Immigrants from Dominica vs Icelander Currently Married
COMPARE
Immigrants from Dominica
Icelander
Currently Married
Currently Married Comparison
Immigrants from Dominica
Icelanders
40.3%
CURRENTLY MARRIED
0.0/ 100
METRIC RATING
330th/ 347
METRIC RANK
47.3%
CURRENTLY MARRIED
82.4/ 100
METRIC RATING
131st/ 347
METRIC RANK
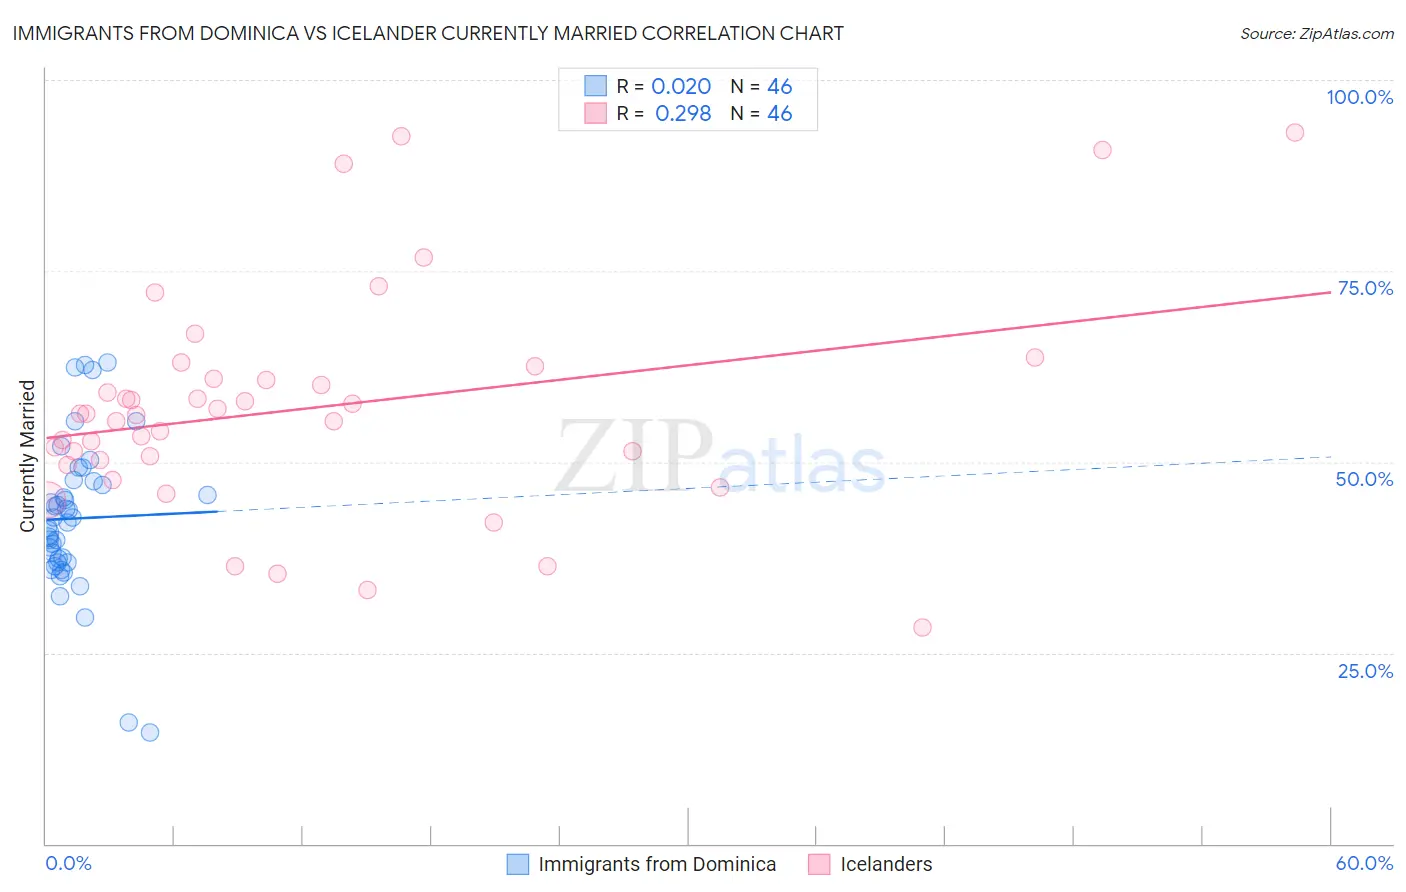
Immigrants from Dominica vs Icelander Currently Married Correlation Chart
The statistical analysis conducted on geographies consisting of 83,796,433 people shows no correlation between the proportion of Immigrants from Dominica and percentage of population currently married in the United States with a correlation coefficient (R) of 0.020 and weighted average of 40.3%. Similarly, the statistical analysis conducted on geographies consisting of 159,647,895 people shows a weak positive correlation between the proportion of Icelanders and percentage of population currently married in the United States with a correlation coefficient (R) of 0.298 and weighted average of 47.3%, a difference of 17.2%.
Currently Married Correlation Summary
| Measurement | Immigrants from Dominica | Icelander |
| Minimum | 14.5% | 28.3% |
| Maximum | 63.0% | 93.2% |
| Range | 48.5% | 64.9% |
| Mean | 42.6% | 57.1% |
| Median | 42.4% | 56.2% |
| Interquartile 25% (IQ1) | 36.9% | 50.3% |
| Interquartile 75% (IQ3) | 47.5% | 60.9% |
| Interquartile Range (IQR) | 10.6% | 10.6% |
| Standard Deviation (Sample) | 10.0% | 14.6% |
| Standard Deviation (Population) | 9.9% | 14.4% |
Similar Demographics by Currently Married
Demographics Similar to Immigrants from Dominica by Currently Married
In terms of currently married, the demographic groups most similar to Immigrants from Dominica are Immigrants from Barbados (40.3%, a difference of 0.020%), Crow (40.4%, a difference of 0.090%), Arapaho (40.5%, a difference of 0.52%), Senegalese (40.6%, a difference of 0.56%), and Immigrants from St. Vincent and the Grenadines (40.1%, a difference of 0.69%).
| Demographics | Rating | Rank | Currently Married |
| Immigrants | West Indies | 0.0 /100 | #323 | Tragic 40.7% |
| Immigrants | Senegal | 0.0 /100 | #324 | Tragic 40.7% |
| U.S. Virgin Islanders | 0.0 /100 | #325 | Tragic 40.7% |
| Barbadians | 0.0 /100 | #326 | Tragic 40.6% |
| Senegalese | 0.0 /100 | #327 | Tragic 40.6% |
| Arapaho | 0.0 /100 | #328 | Tragic 40.5% |
| Crow | 0.0 /100 | #329 | Tragic 40.4% |
| Immigrants | Dominica | 0.0 /100 | #330 | Tragic 40.3% |
| Immigrants | Barbados | 0.0 /100 | #331 | Tragic 40.3% |
| Immigrants | St. Vincent and the Grenadines | 0.0 /100 | #332 | Tragic 40.1% |
| Yup'ik | 0.0 /100 | #333 | Tragic 39.9% |
| Puerto Ricans | 0.0 /100 | #334 | Tragic 39.9% |
| Lumbee | 0.0 /100 | #335 | Tragic 39.8% |
| British West Indians | 0.0 /100 | #336 | Tragic 39.8% |
| Blacks/African Americans | 0.0 /100 | #337 | Tragic 39.6% |
Demographics Similar to Icelanders by Currently Married
In terms of currently married, the demographic groups most similar to Icelanders are Immigrants from Iraq (47.3%, a difference of 0.020%), Afghan (47.3%, a difference of 0.040%), Sri Lankan (47.3%, a difference of 0.050%), Immigrants from Malaysia (47.3%, a difference of 0.080%), and Immigrants from Australia (47.3%, a difference of 0.080%).
| Demographics | Rating | Rank | Currently Married |
| Laotians | 86.6 /100 | #124 | Excellent 47.4% |
| Okinawans | 85.3 /100 | #125 | Excellent 47.4% |
| Immigrants | Jordan | 84.9 /100 | #126 | Excellent 47.4% |
| New Zealanders | 84.9 /100 | #127 | Excellent 47.4% |
| Portuguese | 84.2 /100 | #128 | Excellent 47.3% |
| Sri Lankans | 83.2 /100 | #129 | Excellent 47.3% |
| Immigrants | Iraq | 82.8 /100 | #130 | Excellent 47.3% |
| Icelanders | 82.4 /100 | #131 | Excellent 47.3% |
| Afghans | 81.8 /100 | #132 | Excellent 47.3% |
| Immigrants | Malaysia | 81.1 /100 | #133 | Excellent 47.3% |
| Immigrants | Australia | 81.1 /100 | #134 | Excellent 47.3% |
| Immigrants | Norway | 79.7 /100 | #135 | Good 47.2% |
| Immigrants | Vietnam | 78.2 /100 | #136 | Good 47.2% |
| Paraguayans | 77.8 /100 | #137 | Good 47.2% |
| Pakistanis | 77.5 /100 | #138 | Good 47.2% |