Immigrants from Saudi Arabia vs Icelander Currently Married
COMPARE
Immigrants from Saudi Arabia
Icelander
Currently Married
Currently Married Comparison
Immigrants from Saudi Arabia
Icelanders
44.7%
CURRENTLY MARRIED
1.1/ 100
METRIC RATING
233rd/ 347
METRIC RANK
47.3%
CURRENTLY MARRIED
82.4/ 100
METRIC RATING
131st/ 347
METRIC RANK
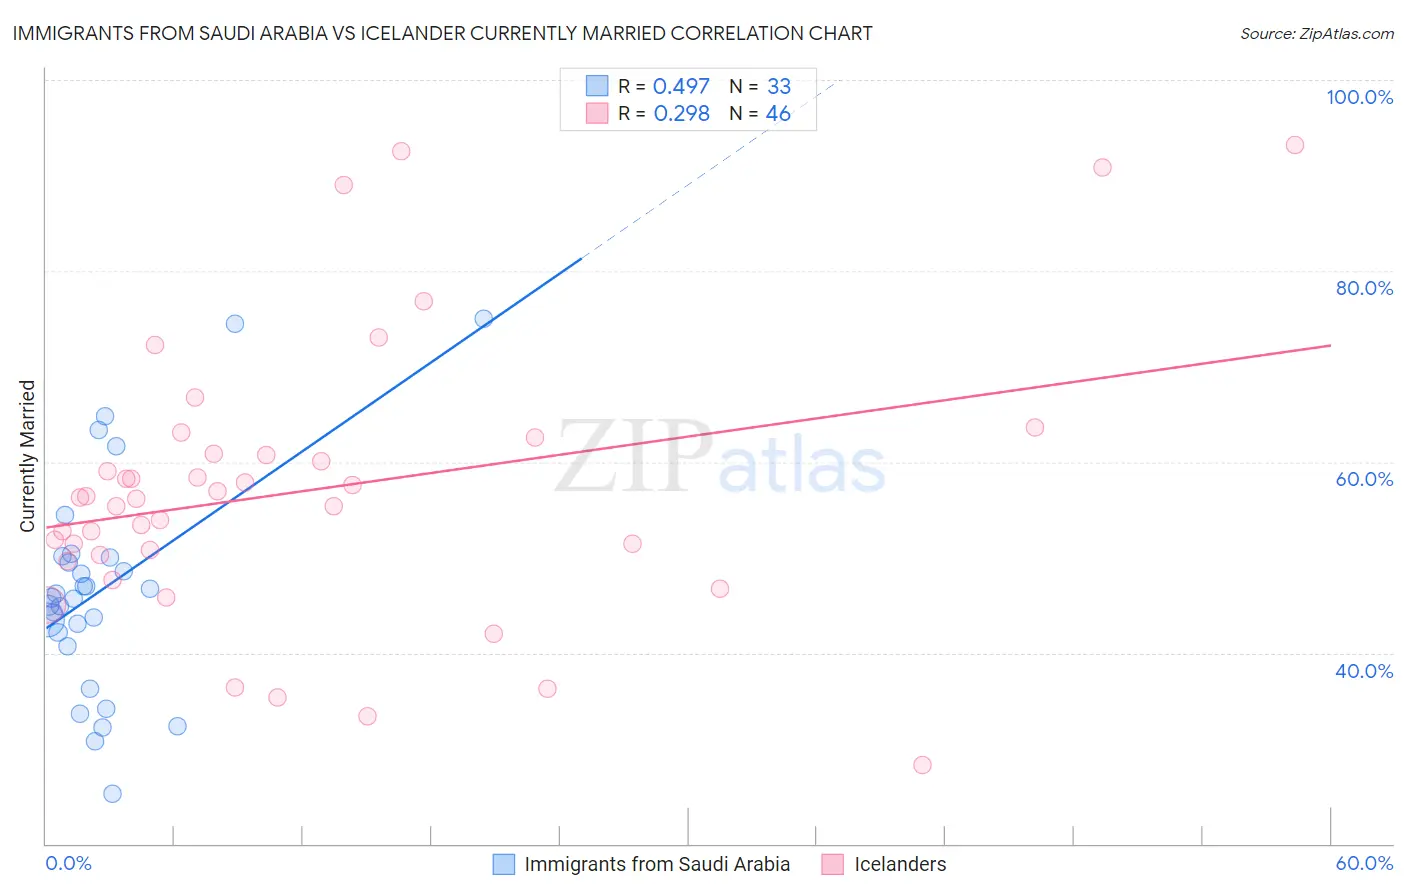
Immigrants from Saudi Arabia vs Icelander Currently Married Correlation Chart
The statistical analysis conducted on geographies consisting of 164,277,877 people shows a moderate positive correlation between the proportion of Immigrants from Saudi Arabia and percentage of population currently married in the United States with a correlation coefficient (R) of 0.497 and weighted average of 44.7%. Similarly, the statistical analysis conducted on geographies consisting of 159,647,895 people shows a weak positive correlation between the proportion of Icelanders and percentage of population currently married in the United States with a correlation coefficient (R) of 0.298 and weighted average of 47.3%, a difference of 5.8%.
Currently Married Correlation Summary
| Measurement | Immigrants from Saudi Arabia | Icelander |
| Minimum | 25.2% | 28.3% |
| Maximum | 75.0% | 93.2% |
| Range | 49.8% | 64.9% |
| Mean | 46.7% | 57.1% |
| Median | 45.8% | 56.2% |
| Interquartile 25% (IQ1) | 41.4% | 50.3% |
| Interquartile 75% (IQ3) | 50.1% | 60.9% |
| Interquartile Range (IQR) | 8.7% | 10.6% |
| Standard Deviation (Sample) | 11.4% | 14.6% |
| Standard Deviation (Population) | 11.3% | 14.4% |
Similar Demographics by Currently Married
Demographics Similar to Immigrants from Saudi Arabia by Currently Married
In terms of currently married, the demographic groups most similar to Immigrants from Saudi Arabia are Iroquois (44.7%, a difference of 0.010%), Nepalese (44.7%, a difference of 0.050%), Alaskan Athabascan (44.6%, a difference of 0.16%), Cuban (44.6%, a difference of 0.17%), and Seminole (44.6%, a difference of 0.18%).
| Demographics | Rating | Rank | Currently Married |
| Comanche | 2.1 /100 | #226 | Tragic 45.0% |
| Spanish Americans | 2.1 /100 | #227 | Tragic 45.0% |
| Immigrants | Uruguay | 2.0 /100 | #228 | Tragic 45.0% |
| Cree | 1.7 /100 | #229 | Tragic 44.9% |
| Immigrants | Kenya | 1.6 /100 | #230 | Tragic 44.9% |
| Immigrants | Panama | 1.5 /100 | #231 | Tragic 44.9% |
| Nepalese | 1.2 /100 | #232 | Tragic 44.7% |
| Immigrants | Saudi Arabia | 1.1 /100 | #233 | Tragic 44.7% |
| Iroquois | 1.1 /100 | #234 | Tragic 44.7% |
| Alaskan Athabascans | 0.9 /100 | #235 | Tragic 44.6% |
| Cubans | 0.9 /100 | #236 | Tragic 44.6% |
| Seminole | 0.9 /100 | #237 | Tragic 44.6% |
| Moroccans | 0.9 /100 | #238 | Tragic 44.6% |
| Immigrants | Mexico | 0.7 /100 | #239 | Tragic 44.5% |
| Mexican American Indians | 0.7 /100 | #240 | Tragic 44.5% |
Demographics Similar to Icelanders by Currently Married
In terms of currently married, the demographic groups most similar to Icelanders are Immigrants from Iraq (47.3%, a difference of 0.020%), Afghan (47.3%, a difference of 0.040%), Sri Lankan (47.3%, a difference of 0.050%), Immigrants from Malaysia (47.3%, a difference of 0.080%), and Immigrants from Australia (47.3%, a difference of 0.080%).
| Demographics | Rating | Rank | Currently Married |
| Laotians | 86.6 /100 | #124 | Excellent 47.4% |
| Okinawans | 85.3 /100 | #125 | Excellent 47.4% |
| Immigrants | Jordan | 84.9 /100 | #126 | Excellent 47.4% |
| New Zealanders | 84.9 /100 | #127 | Excellent 47.4% |
| Portuguese | 84.2 /100 | #128 | Excellent 47.3% |
| Sri Lankans | 83.2 /100 | #129 | Excellent 47.3% |
| Immigrants | Iraq | 82.8 /100 | #130 | Excellent 47.3% |
| Icelanders | 82.4 /100 | #131 | Excellent 47.3% |
| Afghans | 81.8 /100 | #132 | Excellent 47.3% |
| Immigrants | Malaysia | 81.1 /100 | #133 | Excellent 47.3% |
| Immigrants | Australia | 81.1 /100 | #134 | Excellent 47.3% |
| Immigrants | Norway | 79.7 /100 | #135 | Good 47.2% |
| Immigrants | Vietnam | 78.2 /100 | #136 | Good 47.2% |
| Paraguayans | 77.8 /100 | #137 | Good 47.2% |
| Pakistanis | 77.5 /100 | #138 | Good 47.2% |