Immigrants from Dominica vs Immigrants from Zaire Currently Married
COMPARE
Immigrants from Dominica
Immigrants from Zaire
Currently Married
Currently Married Comparison
Immigrants from Dominica
Immigrants from Zaire
40.3%
CURRENTLY MARRIED
0.0/ 100
METRIC RATING
330th/ 347
METRIC RANK
42.0%
CURRENTLY MARRIED
0.0/ 100
METRIC RATING
302nd/ 347
METRIC RANK
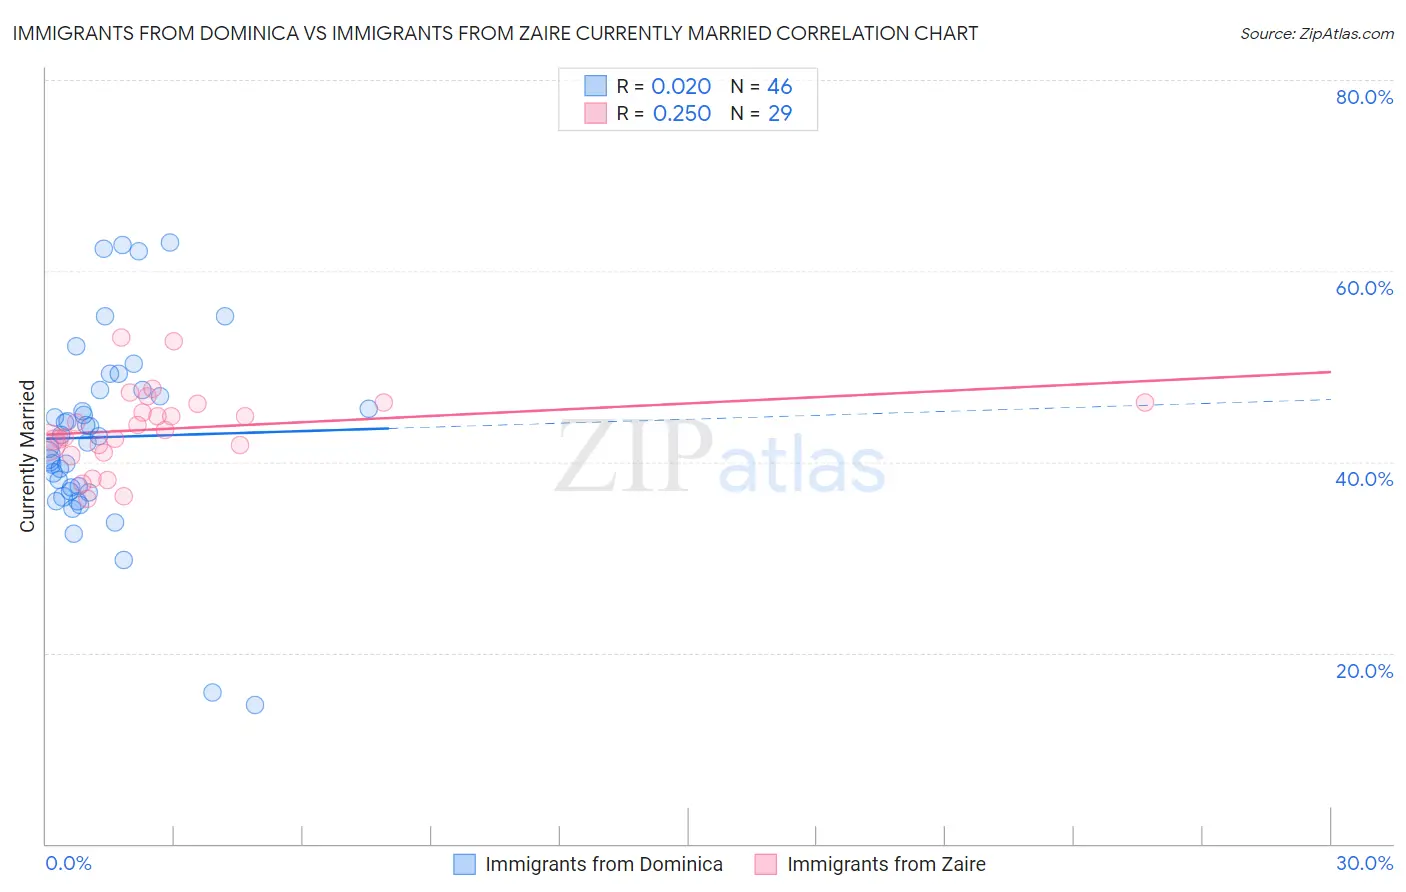
Immigrants from Dominica vs Immigrants from Zaire Currently Married Correlation Chart
The statistical analysis conducted on geographies consisting of 83,796,433 people shows no correlation between the proportion of Immigrants from Dominica and percentage of population currently married in the United States with a correlation coefficient (R) of 0.020 and weighted average of 40.3%. Similarly, the statistical analysis conducted on geographies consisting of 107,251,110 people shows a weak positive correlation between the proportion of Immigrants from Zaire and percentage of population currently married in the United States with a correlation coefficient (R) of 0.250 and weighted average of 42.0%, a difference of 4.0%.
Currently Married Correlation Summary
| Measurement | Immigrants from Dominica | Immigrants from Zaire |
| Minimum | 14.5% | 36.1% |
| Maximum | 63.0% | 53.1% |
| Range | 48.5% | 16.9% |
| Mean | 42.6% | 43.5% |
| Median | 42.4% | 43.4% |
| Interquartile 25% (IQ1) | 36.9% | 41.4% |
| Interquartile 75% (IQ3) | 47.5% | 46.1% |
| Interquartile Range (IQR) | 10.6% | 4.8% |
| Standard Deviation (Sample) | 10.0% | 4.1% |
| Standard Deviation (Population) | 9.9% | 4.0% |
Similar Demographics by Currently Married
Demographics Similar to Immigrants from Dominica by Currently Married
In terms of currently married, the demographic groups most similar to Immigrants from Dominica are Immigrants from Barbados (40.3%, a difference of 0.020%), Crow (40.4%, a difference of 0.090%), Arapaho (40.5%, a difference of 0.52%), Senegalese (40.6%, a difference of 0.56%), and Immigrants from St. Vincent and the Grenadines (40.1%, a difference of 0.69%).
| Demographics | Rating | Rank | Currently Married |
| Immigrants | West Indies | 0.0 /100 | #323 | Tragic 40.7% |
| Immigrants | Senegal | 0.0 /100 | #324 | Tragic 40.7% |
| U.S. Virgin Islanders | 0.0 /100 | #325 | Tragic 40.7% |
| Barbadians | 0.0 /100 | #326 | Tragic 40.6% |
| Senegalese | 0.0 /100 | #327 | Tragic 40.6% |
| Arapaho | 0.0 /100 | #328 | Tragic 40.5% |
| Crow | 0.0 /100 | #329 | Tragic 40.4% |
| Immigrants | Dominica | 0.0 /100 | #330 | Tragic 40.3% |
| Immigrants | Barbados | 0.0 /100 | #331 | Tragic 40.3% |
| Immigrants | St. Vincent and the Grenadines | 0.0 /100 | #332 | Tragic 40.1% |
| Yup'ik | 0.0 /100 | #333 | Tragic 39.9% |
| Puerto Ricans | 0.0 /100 | #334 | Tragic 39.9% |
| Lumbee | 0.0 /100 | #335 | Tragic 39.8% |
| British West Indians | 0.0 /100 | #336 | Tragic 39.8% |
| Blacks/African Americans | 0.0 /100 | #337 | Tragic 39.6% |
Demographics Similar to Immigrants from Zaire by Currently Married
In terms of currently married, the demographic groups most similar to Immigrants from Zaire are Sioux (41.9%, a difference of 0.010%), Immigrants from Bahamas (41.9%, a difference of 0.13%), Immigrants from Trinidad and Tobago (41.9%, a difference of 0.16%), Immigrants from Guyana (41.9%, a difference of 0.17%), and Immigrants from Yemen (42.1%, a difference of 0.25%).
| Demographics | Rating | Rank | Currently Married |
| Immigrants | Western Africa | 0.0 /100 | #295 | Tragic 42.4% |
| Menominee | 0.0 /100 | #296 | Tragic 42.3% |
| Cheyenne | 0.0 /100 | #297 | Tragic 42.2% |
| Immigrants | Honduras | 0.0 /100 | #298 | Tragic 42.2% |
| Liberians | 0.0 /100 | #299 | Tragic 42.2% |
| Belizeans | 0.0 /100 | #300 | Tragic 42.2% |
| Immigrants | Yemen | 0.0 /100 | #301 | Tragic 42.1% |
| Immigrants | Zaire | 0.0 /100 | #302 | Tragic 42.0% |
| Sioux | 0.0 /100 | #303 | Tragic 41.9% |
| Immigrants | Bahamas | 0.0 /100 | #304 | Tragic 41.9% |
| Immigrants | Trinidad and Tobago | 0.0 /100 | #305 | Tragic 41.9% |
| Immigrants | Guyana | 0.0 /100 | #306 | Tragic 41.9% |
| Africans | 0.0 /100 | #307 | Tragic 41.8% |
| Immigrants | Belize | 0.0 /100 | #308 | Tragic 41.8% |
| Immigrants | Liberia | 0.0 /100 | #309 | Tragic 41.8% |