Immigrants from Burma/Myanmar vs Uruguayan Births to Unmarried Women
COMPARE
Immigrants from Burma/Myanmar
Uruguayan
Births to Unmarried Women
Births to Unmarried Women Comparison
Immigrants from Burma/Myanmar
Uruguayans
32.9%
BIRTHS TO UNMARRIED WOMEN
16.7/ 100
METRIC RATING
201st/ 347
METRIC RANK
33.1%
BIRTHS TO UNMARRIED WOMEN
12.8/ 100
METRIC RATING
206th/ 347
METRIC RANK
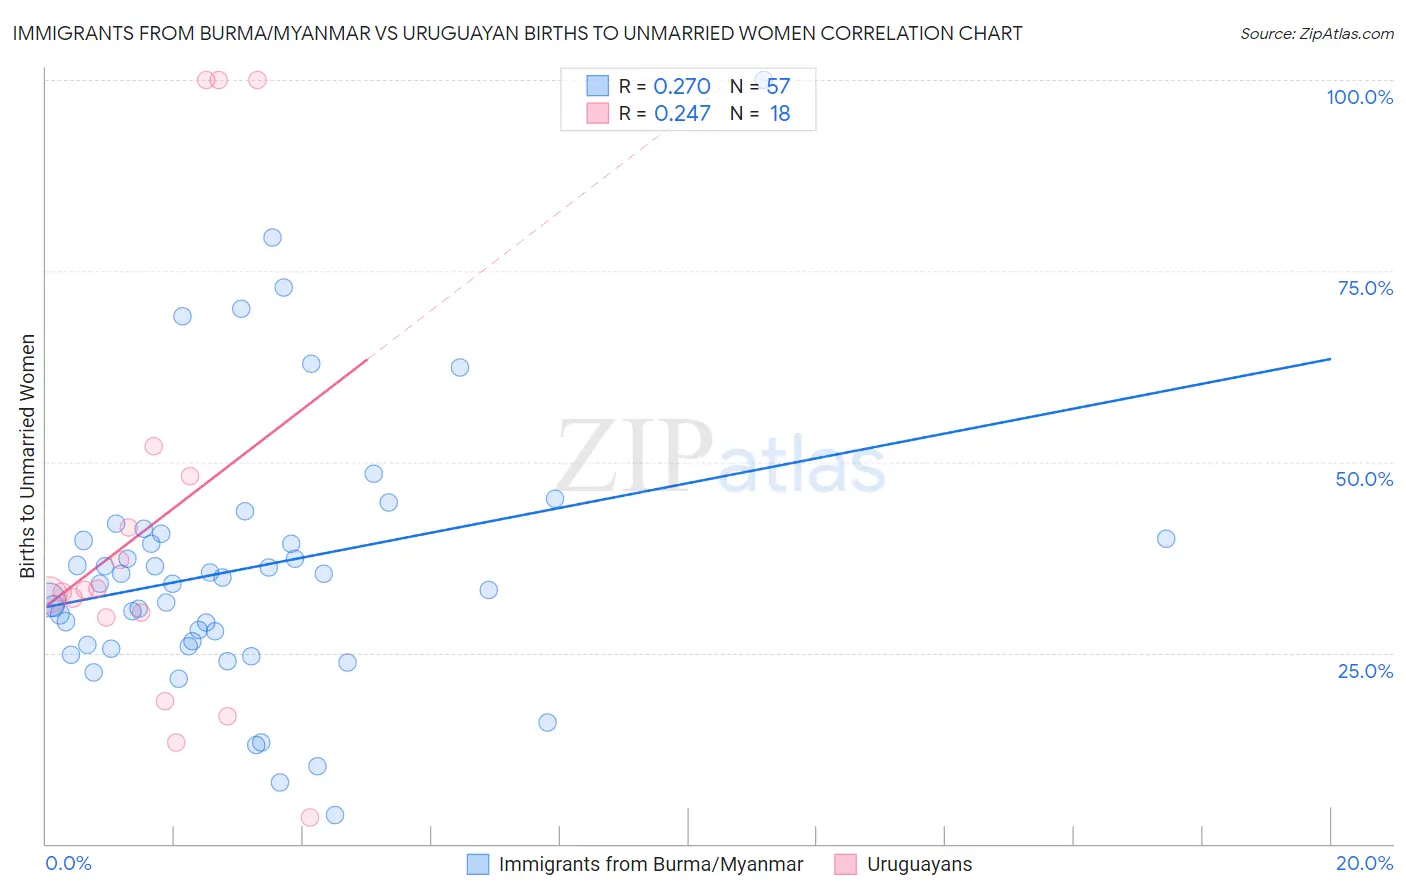
Immigrants from Burma/Myanmar vs Uruguayan Births to Unmarried Women Correlation Chart
The statistical analysis conducted on geographies consisting of 166,895,809 people shows a weak positive correlation between the proportion of Immigrants from Burma/Myanmar and percentage of births to unmarried women in the United States with a correlation coefficient (R) of 0.270 and weighted average of 32.9%. Similarly, the statistical analysis conducted on geographies consisting of 140,023,012 people shows a weak positive correlation between the proportion of Uruguayans and percentage of births to unmarried women in the United States with a correlation coefficient (R) of 0.247 and weighted average of 33.1%, a difference of 0.70%.
Births to Unmarried Women Correlation Summary
| Measurement | Immigrants from Burma/Myanmar | Uruguayan |
| Minimum | 3.8% | 3.4% |
| Maximum | 100.0% | 100.0% |
| Range | 96.2% | 96.6% |
| Mean | 36.0% | 41.9% |
| Median | 34.0% | 33.1% |
| Interquartile 25% (IQ1) | 25.9% | 29.6% |
| Interquartile 75% (IQ3) | 40.3% | 48.1% |
| Interquartile Range (IQR) | 14.4% | 18.5% |
| Standard Deviation (Sample) | 17.5% | 29.2% |
| Standard Deviation (Population) | 17.4% | 28.3% |
Demographics Similar to Immigrants from Burma/Myanmar and Uruguayans by Births to Unmarried Women
In terms of births to unmarried women, the demographic groups most similar to Immigrants from Burma/Myanmar are Immigrants from Micronesia (32.9%, a difference of 0.010%), Immigrants from Germany (32.8%, a difference of 0.33%), Immigrants from Thailand (32.8%, a difference of 0.34%), Ute (33.0%, a difference of 0.39%), and Immigrants from Africa (33.0%, a difference of 0.41%). Similarly, the demographic groups most similar to Uruguayans are German Russian (33.1%, a difference of 0.060%), Immigrants from Africa (33.0%, a difference of 0.29%), Immigrants from Sudan (33.2%, a difference of 0.29%), Ute (33.0%, a difference of 0.31%), and Hawaiian (33.2%, a difference of 0.32%).
| Demographics | Rating | Rank | Births to Unmarried Women |
| Fijians | 31.1 /100 | #193 | Fair 32.3% |
| Sudanese | 27.3 /100 | #194 | Fair 32.4% |
| Samoans | 21.9 /100 | #195 | Fair 32.6% |
| Immigrants | Colombia | 21.7 /100 | #196 | Fair 32.6% |
| Immigrants | Immigrants | 20.6 /100 | #197 | Fair 32.7% |
| Costa Ricans | 20.3 /100 | #198 | Fair 32.7% |
| Immigrants | Thailand | 18.9 /100 | #199 | Poor 32.8% |
| Immigrants | Germany | 18.8 /100 | #200 | Poor 32.8% |
| Immigrants | Burma/Myanmar | 16.7 /100 | #201 | Poor 32.9% |
| Immigrants | Micronesia | 16.6 /100 | #202 | Poor 32.9% |
| Ute | 14.4 /100 | #203 | Poor 33.0% |
| Immigrants | Africa | 14.3 /100 | #204 | Poor 33.0% |
| German Russians | 13.1 /100 | #205 | Poor 33.1% |
| Uruguayans | 12.8 /100 | #206 | Poor 33.1% |
| Immigrants | Sudan | 11.5 /100 | #207 | Poor 33.2% |
| Hawaiians | 11.3 /100 | #208 | Poor 33.2% |
| Whites/Caucasians | 10.7 /100 | #209 | Poor 33.3% |
| Scotch-Irish | 10.7 /100 | #210 | Poor 33.3% |
| Ecuadorians | 10.5 /100 | #211 | Poor 33.3% |
| Celtics | 10.2 /100 | #212 | Poor 33.3% |
| Immigrants | Costa Rica | 9.5 /100 | #213 | Tragic 33.4% |