Immigrants from Burma/Myanmar vs Immigrants from Liberia Births to Unmarried Women
COMPARE
Immigrants from Burma/Myanmar
Immigrants from Liberia
Births to Unmarried Women
Births to Unmarried Women Comparison
Immigrants from Burma/Myanmar
Immigrants from Liberia
32.9%
BIRTHS TO UNMARRIED WOMEN
16.7/ 100
METRIC RATING
201st/ 347
METRIC RANK
37.6%
BIRTHS TO UNMARRIED WOMEN
0.0/ 100
METRIC RATING
288th/ 347
METRIC RANK
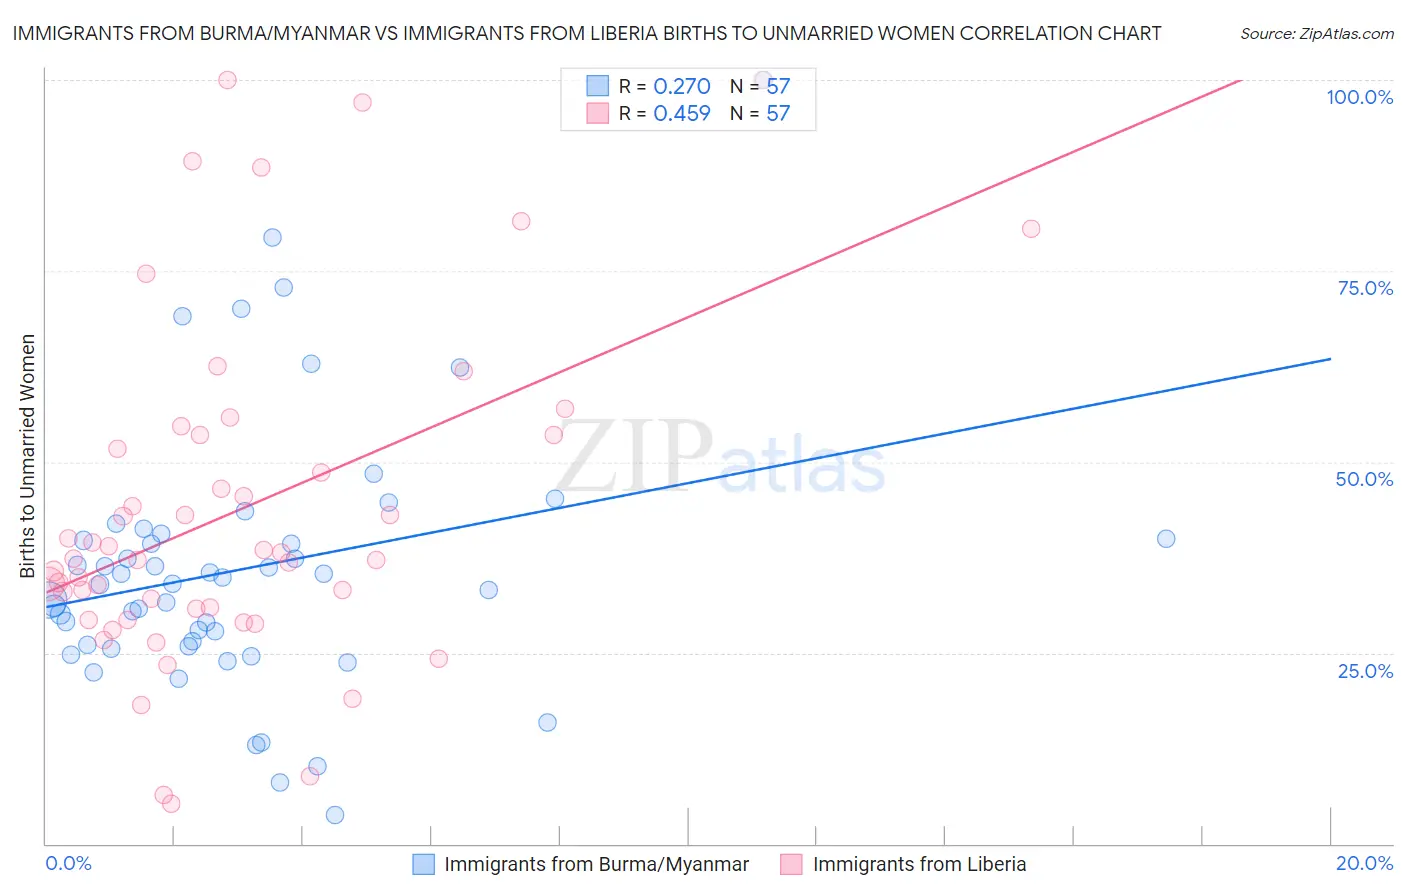
Immigrants from Burma/Myanmar vs Immigrants from Liberia Births to Unmarried Women Correlation Chart
The statistical analysis conducted on geographies consisting of 166,895,809 people shows a weak positive correlation between the proportion of Immigrants from Burma/Myanmar and percentage of births to unmarried women in the United States with a correlation coefficient (R) of 0.270 and weighted average of 32.9%. Similarly, the statistical analysis conducted on geographies consisting of 132,597,891 people shows a moderate positive correlation between the proportion of Immigrants from Liberia and percentage of births to unmarried women in the United States with a correlation coefficient (R) of 0.459 and weighted average of 37.6%, a difference of 14.5%.
Births to Unmarried Women Correlation Summary
| Measurement | Immigrants from Burma/Myanmar | Immigrants from Liberia |
| Minimum | 3.8% | 5.3% |
| Maximum | 100.0% | 100.0% |
| Range | 96.2% | 94.7% |
| Mean | 36.0% | 43.7% |
| Median | 34.0% | 37.4% |
| Interquartile 25% (IQ1) | 25.9% | 30.1% |
| Interquartile 75% (IQ3) | 40.3% | 53.5% |
| Interquartile Range (IQR) | 14.4% | 23.4% |
| Standard Deviation (Sample) | 17.5% | 22.3% |
| Standard Deviation (Population) | 17.4% | 22.1% |
Similar Demographics by Births to Unmarried Women
Demographics Similar to Immigrants from Burma/Myanmar by Births to Unmarried Women
In terms of births to unmarried women, the demographic groups most similar to Immigrants from Burma/Myanmar are Immigrants from Micronesia (32.9%, a difference of 0.010%), Immigrants from Germany (32.8%, a difference of 0.33%), Immigrants from Thailand (32.8%, a difference of 0.34%), Ute (33.0%, a difference of 0.39%), and Immigrants from Africa (33.0%, a difference of 0.41%).
| Demographics | Rating | Rank | Births to Unmarried Women |
| Sudanese | 27.3 /100 | #194 | Fair 32.4% |
| Samoans | 21.9 /100 | #195 | Fair 32.6% |
| Immigrants | Colombia | 21.7 /100 | #196 | Fair 32.6% |
| Immigrants | Immigrants | 20.6 /100 | #197 | Fair 32.7% |
| Costa Ricans | 20.3 /100 | #198 | Fair 32.7% |
| Immigrants | Thailand | 18.9 /100 | #199 | Poor 32.8% |
| Immigrants | Germany | 18.8 /100 | #200 | Poor 32.8% |
| Immigrants | Burma/Myanmar | 16.7 /100 | #201 | Poor 32.9% |
| Immigrants | Micronesia | 16.6 /100 | #202 | Poor 32.9% |
| Ute | 14.4 /100 | #203 | Poor 33.0% |
| Immigrants | Africa | 14.3 /100 | #204 | Poor 33.0% |
| German Russians | 13.1 /100 | #205 | Poor 33.1% |
| Uruguayans | 12.8 /100 | #206 | Poor 33.1% |
| Immigrants | Sudan | 11.5 /100 | #207 | Poor 33.2% |
| Hawaiians | 11.3 /100 | #208 | Poor 33.2% |
Demographics Similar to Immigrants from Liberia by Births to Unmarried Women
In terms of births to unmarried women, the demographic groups most similar to Immigrants from Liberia are Creek (37.6%, a difference of 0.17%), Alaskan Athabascan (37.7%, a difference of 0.23%), Hispanic or Latino (37.8%, a difference of 0.37%), Immigrants from Guatemala (37.5%, a difference of 0.40%), and Immigrants from Mexico (37.5%, a difference of 0.41%).
| Demographics | Rating | Rank | Births to Unmarried Women |
| Immigrants | Belize | 0.1 /100 | #281 | Tragic 37.3% |
| Liberians | 0.0 /100 | #282 | Tragic 37.4% |
| Spanish American Indians | 0.0 /100 | #283 | Tragic 37.4% |
| Immigrants | Central America | 0.0 /100 | #284 | Tragic 37.4% |
| Immigrants | Mexico | 0.0 /100 | #285 | Tragic 37.5% |
| Immigrants | Guatemala | 0.0 /100 | #286 | Tragic 37.5% |
| Creek | 0.0 /100 | #287 | Tragic 37.6% |
| Immigrants | Liberia | 0.0 /100 | #288 | Tragic 37.6% |
| Alaskan Athabascans | 0.0 /100 | #289 | Tragic 37.7% |
| Hispanics or Latinos | 0.0 /100 | #290 | Tragic 37.8% |
| Seminole | 0.0 /100 | #291 | Tragic 37.9% |
| Blackfeet | 0.0 /100 | #292 | Tragic 37.9% |
| Immigrants | Nicaragua | 0.0 /100 | #293 | Tragic 38.0% |
| British West Indians | 0.0 /100 | #294 | Tragic 38.0% |
| Iroquois | 0.0 /100 | #295 | Tragic 38.2% |