Immigrants from Burma/Myanmar vs Paraguayan Currently Married
COMPARE
Immigrants from Burma/Myanmar
Paraguayan
Currently Married
Currently Married Comparison
Immigrants from Burma/Myanmar
Paraguayans
44.3%
CURRENTLY MARRIED
0.4/ 100
METRIC RATING
246th/ 347
METRIC RANK
47.2%
CURRENTLY MARRIED
77.8/ 100
METRIC RATING
137th/ 347
METRIC RANK
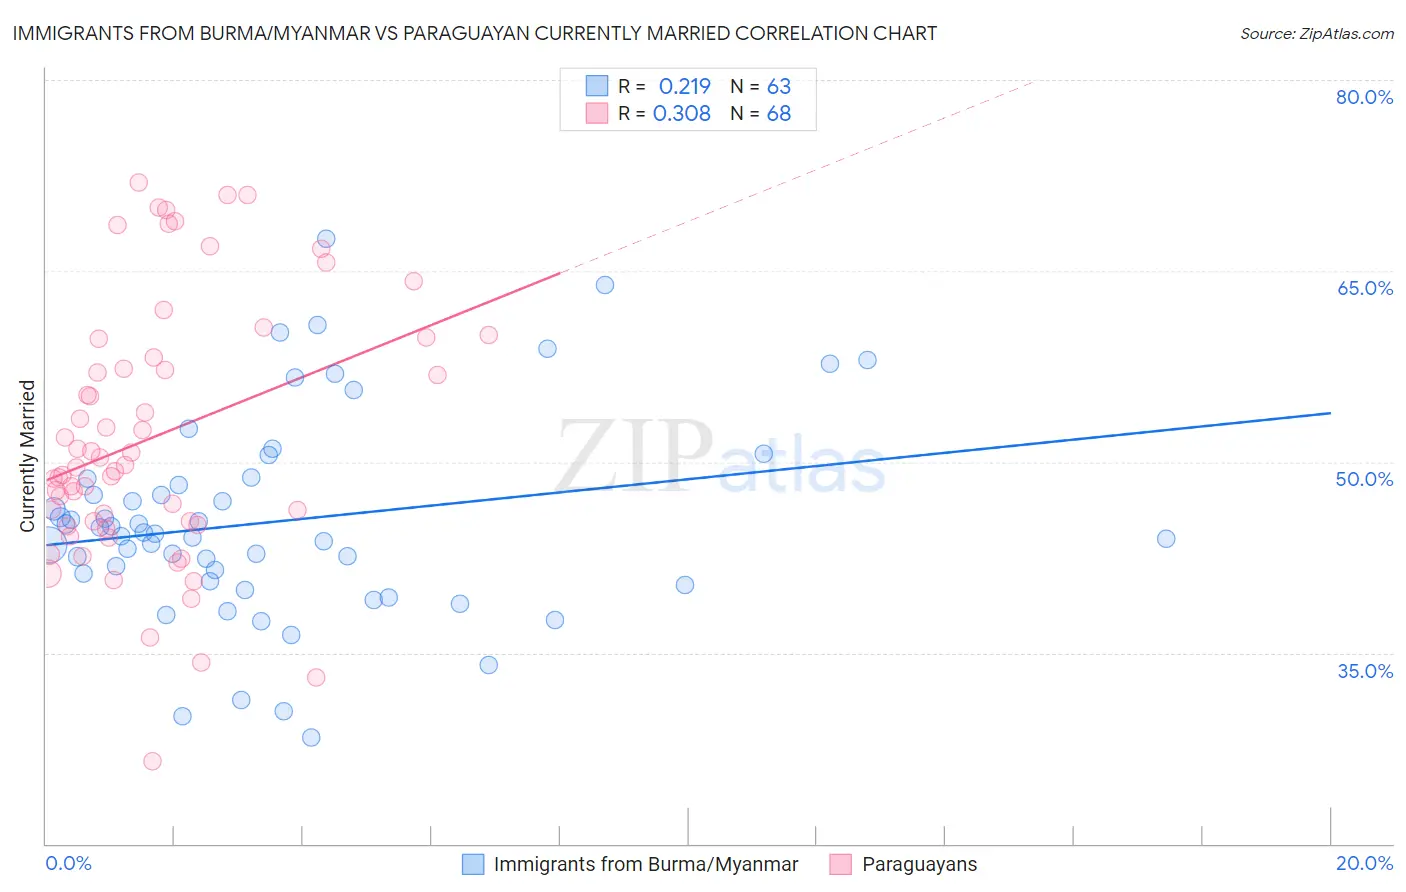
Immigrants from Burma/Myanmar vs Paraguayan Currently Married Correlation Chart
The statistical analysis conducted on geographies consisting of 172,355,169 people shows a weak positive correlation between the proportion of Immigrants from Burma/Myanmar and percentage of population currently married in the United States with a correlation coefficient (R) of 0.219 and weighted average of 44.3%. Similarly, the statistical analysis conducted on geographies consisting of 95,115,093 people shows a mild positive correlation between the proportion of Paraguayans and percentage of population currently married in the United States with a correlation coefficient (R) of 0.308 and weighted average of 47.2%, a difference of 6.5%.
Currently Married Correlation Summary
| Measurement | Immigrants from Burma/Myanmar | Paraguayan |
| Minimum | 28.3% | 26.5% |
| Maximum | 67.5% | 71.9% |
| Range | 39.2% | 45.4% |
| Mean | 45.3% | 52.0% |
| Median | 44.3% | 49.7% |
| Interquartile 25% (IQ1) | 40.6% | 45.2% |
| Interquartile 75% (IQ3) | 48.7% | 58.9% |
| Interquartile Range (IQR) | 8.0% | 13.8% |
| Standard Deviation (Sample) | 8.1% | 10.2% |
| Standard Deviation (Population) | 8.0% | 10.2% |
Similar Demographics by Currently Married
Demographics Similar to Immigrants from Burma/Myanmar by Currently Married
In terms of currently married, the demographic groups most similar to Immigrants from Burma/Myanmar are Immigrants from Armenia (44.3%, a difference of 0.070%), Ugandan (44.2%, a difference of 0.13%), Nicaraguan (44.2%, a difference of 0.22%), Immigrants from Cameroon (44.2%, a difference of 0.24%), and Immigrants from Eastern Africa (44.2%, a difference of 0.26%).
| Demographics | Rating | Rank | Currently Married |
| Immigrants | Mexico | 0.7 /100 | #239 | Tragic 44.5% |
| Mexican American Indians | 0.7 /100 | #240 | Tragic 44.5% |
| Ethiopians | 0.7 /100 | #241 | Tragic 44.5% |
| Immigrants | Cambodia | 0.7 /100 | #242 | Tragic 44.5% |
| Immigrants | Ethiopia | 0.7 /100 | #243 | Tragic 44.5% |
| Japanese | 0.6 /100 | #244 | Tragic 44.5% |
| Immigrants | Armenia | 0.4 /100 | #245 | Tragic 44.3% |
| Immigrants | Burma/Myanmar | 0.4 /100 | #246 | Tragic 44.3% |
| Ugandans | 0.4 /100 | #247 | Tragic 44.2% |
| Nicaraguans | 0.3 /100 | #248 | Tragic 44.2% |
| Immigrants | Cameroon | 0.3 /100 | #249 | Tragic 44.2% |
| Immigrants | Eastern Africa | 0.3 /100 | #250 | Tragic 44.2% |
| Blackfeet | 0.3 /100 | #251 | Tragic 44.2% |
| Hispanics or Latinos | 0.3 /100 | #252 | Tragic 44.1% |
| Immigrants | Central America | 0.3 /100 | #253 | Tragic 44.1% |
Demographics Similar to Paraguayans by Currently Married
In terms of currently married, the demographic groups most similar to Paraguayans are Immigrants from Vietnam (47.2%, a difference of 0.020%), Pakistani (47.2%, a difference of 0.020%), Yugoslavian (47.2%, a difference of 0.020%), Immigrants from Norway (47.2%, a difference of 0.10%), and Cajun (47.1%, a difference of 0.13%).
| Demographics | Rating | Rank | Currently Married |
| Immigrants | Iraq | 82.8 /100 | #130 | Excellent 47.3% |
| Icelanders | 82.4 /100 | #131 | Excellent 47.3% |
| Afghans | 81.8 /100 | #132 | Excellent 47.3% |
| Immigrants | Malaysia | 81.1 /100 | #133 | Excellent 47.3% |
| Immigrants | Australia | 81.1 /100 | #134 | Excellent 47.3% |
| Immigrants | Norway | 79.7 /100 | #135 | Good 47.2% |
| Immigrants | Vietnam | 78.2 /100 | #136 | Good 47.2% |
| Paraguayans | 77.8 /100 | #137 | Good 47.2% |
| Pakistanis | 77.5 /100 | #138 | Good 47.2% |
| Yugoslavians | 77.4 /100 | #139 | Good 47.2% |
| Cajuns | 75.3 /100 | #140 | Good 47.1% |
| Venezuelans | 74.4 /100 | #141 | Good 47.1% |
| Argentineans | 74.4 /100 | #142 | Good 47.1% |
| Guamanians/Chamorros | 74.2 /100 | #143 | Good 47.1% |
| Hmong | 73.4 /100 | #144 | Good 47.1% |