South American Indian vs Paraguayan Currently Married
COMPARE
South American Indian
Paraguayan
Currently Married
Currently Married Comparison
South American Indians
Paraguayans
45.8%
CURRENTLY MARRIED
11.5/ 100
METRIC RATING
205th/ 347
METRIC RANK
47.2%
CURRENTLY MARRIED
77.8/ 100
METRIC RATING
137th/ 347
METRIC RANK
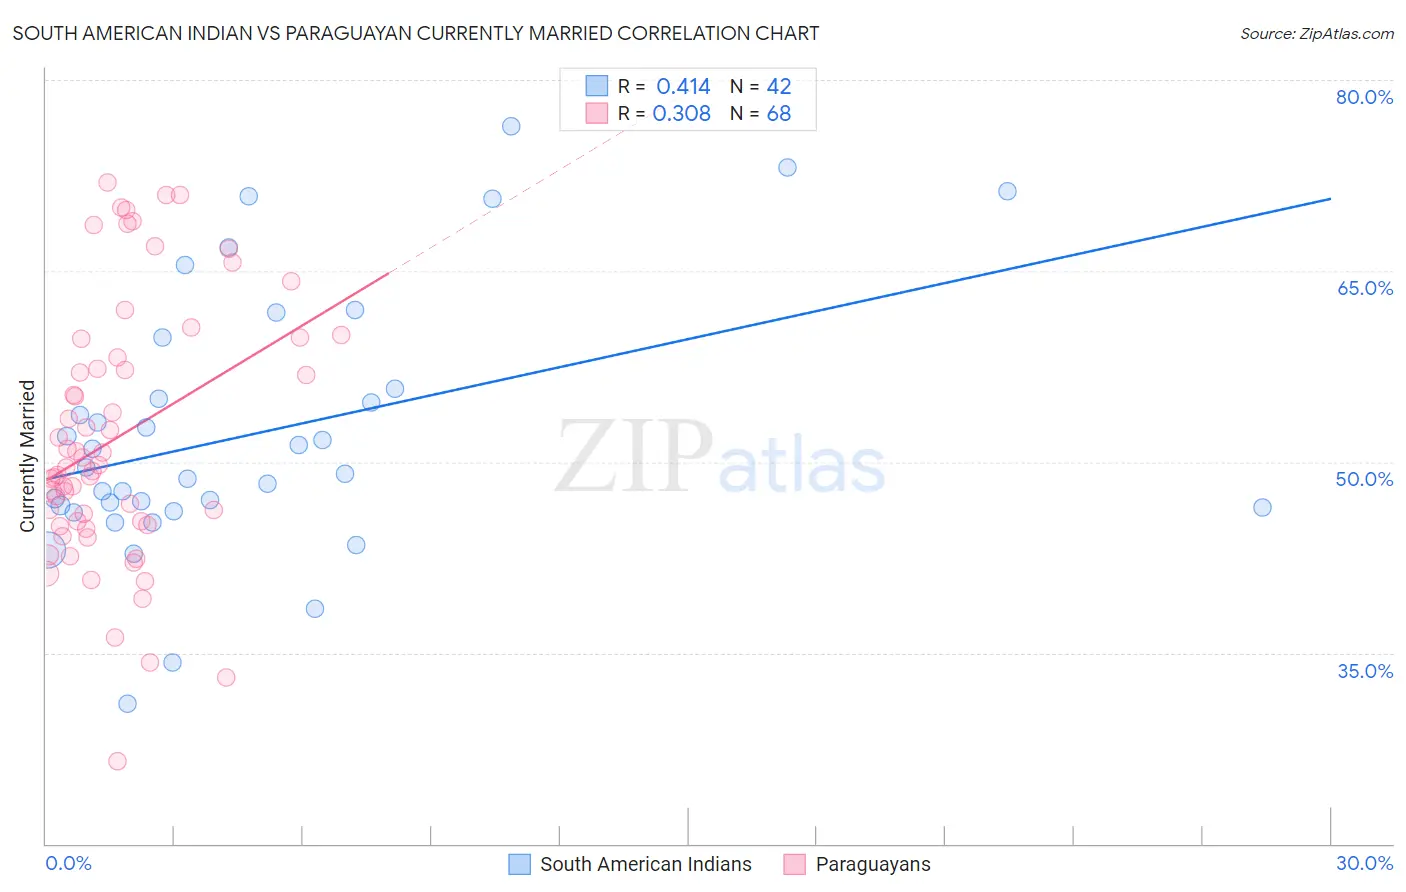
South American Indian vs Paraguayan Currently Married Correlation Chart
The statistical analysis conducted on geographies consisting of 164,571,412 people shows a moderate positive correlation between the proportion of South American Indians and percentage of population currently married in the United States with a correlation coefficient (R) of 0.414 and weighted average of 45.8%. Similarly, the statistical analysis conducted on geographies consisting of 95,115,093 people shows a mild positive correlation between the proportion of Paraguayans and percentage of population currently married in the United States with a correlation coefficient (R) of 0.308 and weighted average of 47.2%, a difference of 3.1%.
Currently Married Correlation Summary
| Measurement | South American Indian | Paraguayan |
| Minimum | 31.0% | 26.5% |
| Maximum | 76.4% | 71.9% |
| Range | 45.4% | 45.4% |
| Mean | 52.3% | 52.0% |
| Median | 49.3% | 49.7% |
| Interquartile 25% (IQ1) | 46.4% | 45.2% |
| Interquartile 75% (IQ3) | 55.7% | 58.9% |
| Interquartile Range (IQR) | 9.3% | 13.8% |
| Standard Deviation (Sample) | 10.3% | 10.2% |
| Standard Deviation (Population) | 10.2% | 10.2% |
Similar Demographics by Currently Married
Demographics Similar to South American Indians by Currently Married
In terms of currently married, the demographic groups most similar to South American Indians are Taiwanese (45.8%, a difference of 0.020%), Immigrants from Spain (45.8%, a difference of 0.020%), Immigrants (45.8%, a difference of 0.020%), Immigrants from South America (45.7%, a difference of 0.060%), and Alsatian (45.7%, a difference of 0.070%).
| Demographics | Rating | Rank | Currently Married |
| Immigrants | Colombia | 21.0 /100 | #198 | Fair 46.1% |
| Immigrants | Costa Rica | 19.6 /100 | #199 | Poor 46.0% |
| Creek | 17.2 /100 | #200 | Poor 46.0% |
| Malaysians | 15.3 /100 | #201 | Poor 45.9% |
| Immigrants | Albania | 14.5 /100 | #202 | Poor 45.9% |
| Taiwanese | 11.7 /100 | #203 | Poor 45.8% |
| Immigrants | Spain | 11.6 /100 | #204 | Poor 45.8% |
| South American Indians | 11.5 /100 | #205 | Poor 45.8% |
| Immigrants | Immigrants | 11.2 /100 | #206 | Poor 45.8% |
| Immigrants | South America | 10.8 /100 | #207 | Poor 45.7% |
| Alsatians | 10.8 /100 | #208 | Poor 45.7% |
| Immigrants | Micronesia | 8.8 /100 | #209 | Tragic 45.6% |
| Uruguayans | 7.9 /100 | #210 | Tragic 45.6% |
| Houma | 7.2 /100 | #211 | Tragic 45.5% |
| Marshallese | 7.2 /100 | #212 | Tragic 45.5% |
Demographics Similar to Paraguayans by Currently Married
In terms of currently married, the demographic groups most similar to Paraguayans are Immigrants from Vietnam (47.2%, a difference of 0.020%), Pakistani (47.2%, a difference of 0.020%), Yugoslavian (47.2%, a difference of 0.020%), Immigrants from Norway (47.2%, a difference of 0.10%), and Cajun (47.1%, a difference of 0.13%).
| Demographics | Rating | Rank | Currently Married |
| Immigrants | Iraq | 82.8 /100 | #130 | Excellent 47.3% |
| Icelanders | 82.4 /100 | #131 | Excellent 47.3% |
| Afghans | 81.8 /100 | #132 | Excellent 47.3% |
| Immigrants | Malaysia | 81.1 /100 | #133 | Excellent 47.3% |
| Immigrants | Australia | 81.1 /100 | #134 | Excellent 47.3% |
| Immigrants | Norway | 79.7 /100 | #135 | Good 47.2% |
| Immigrants | Vietnam | 78.2 /100 | #136 | Good 47.2% |
| Paraguayans | 77.8 /100 | #137 | Good 47.2% |
| Pakistanis | 77.5 /100 | #138 | Good 47.2% |
| Yugoslavians | 77.4 /100 | #139 | Good 47.2% |
| Cajuns | 75.3 /100 | #140 | Good 47.1% |
| Venezuelans | 74.4 /100 | #141 | Good 47.1% |
| Argentineans | 74.4 /100 | #142 | Good 47.1% |
| Guamanians/Chamorros | 74.2 /100 | #143 | Good 47.1% |
| Hmong | 73.4 /100 | #144 | Good 47.1% |