Immigrants from the Azores vs Immigrants from Cameroon Family Households with Children
COMPARE
Immigrants from the Azores
Immigrants from Cameroon
Family Households with Children
Family Households with Children Comparison
Immigrants from the Azores
Immigrants from Cameroon
28.1%
FAMILY HOUSEHOLDS WITH CHILDREN
98.8/ 100
METRIC RATING
99th/ 347
METRIC RANK
29.2%
FAMILY HOUSEHOLDS WITH CHILDREN
100.0/ 100
METRIC RATING
37th/ 347
METRIC RANK
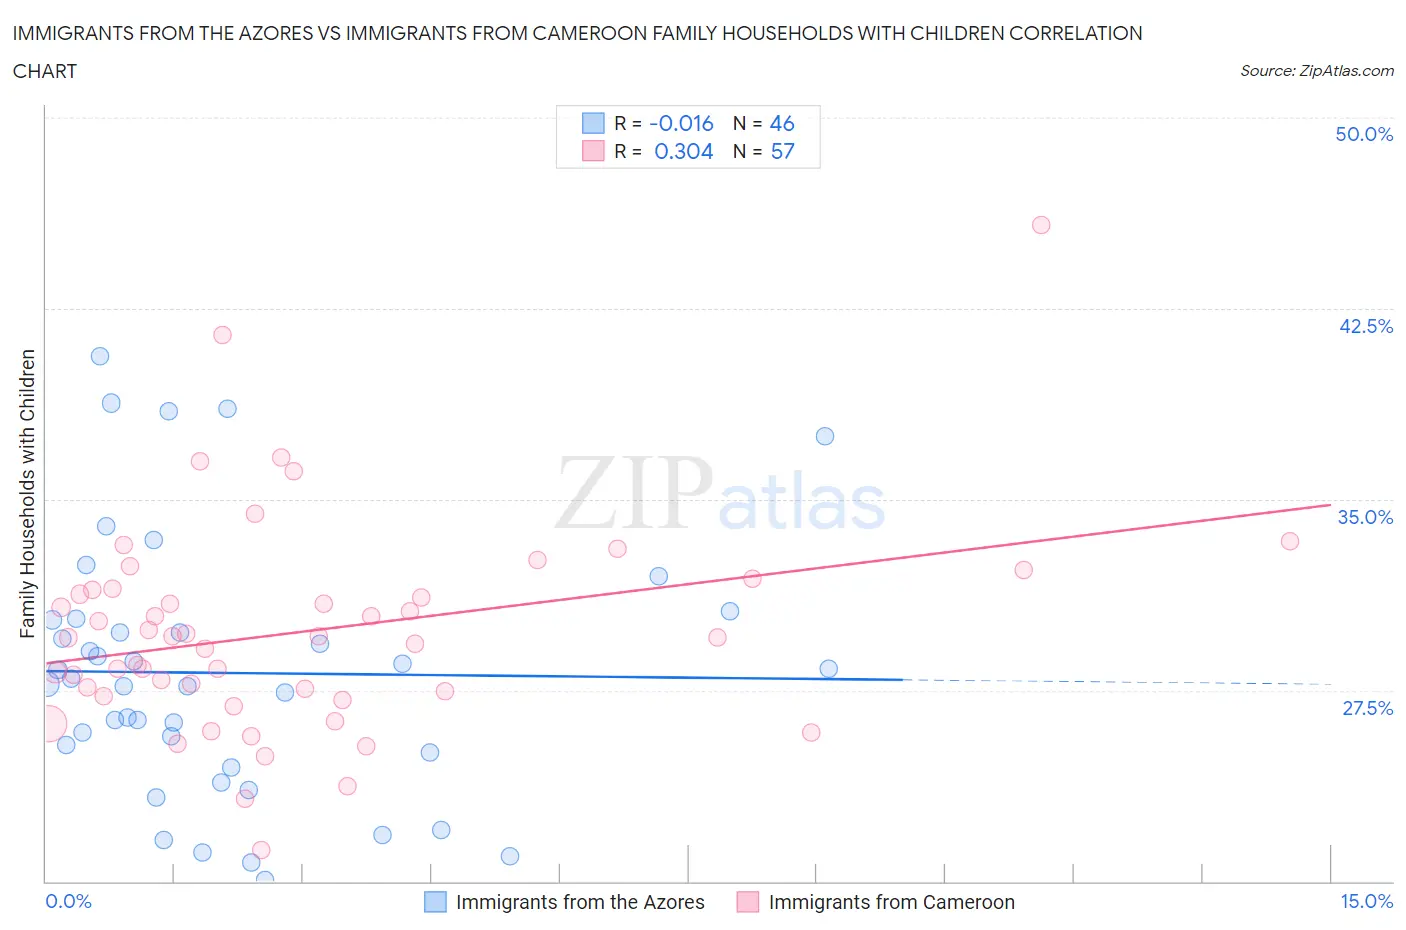
Immigrants from the Azores vs Immigrants from Cameroon Family Households with Children Correlation Chart
The statistical analysis conducted on geographies consisting of 46,253,049 people shows no correlation between the proportion of Immigrants from the Azores and percentage of family households with children in the United States with a correlation coefficient (R) of -0.016 and weighted average of 28.1%. Similarly, the statistical analysis conducted on geographies consisting of 130,728,494 people shows a mild positive correlation between the proportion of Immigrants from Cameroon and percentage of family households with children in the United States with a correlation coefficient (R) of 0.304 and weighted average of 29.2%, a difference of 3.9%.
Family Households with Children Correlation Summary
| Measurement | Immigrants from the Azores | Immigrants from Cameroon |
| Minimum | 20.0% | 21.2% |
| Maximum | 40.6% | 45.8% |
| Range | 20.6% | 24.6% |
| Mean | 28.2% | 29.8% |
| Median | 27.8% | 29.6% |
| Interquartile 25% (IQ1) | 25.0% | 27.4% |
| Interquartile 75% (IQ3) | 30.3% | 31.5% |
| Interquartile Range (IQR) | 5.2% | 4.1% |
| Standard Deviation (Sample) | 5.1% | 4.2% |
| Standard Deviation (Population) | 5.0% | 4.1% |
Similar Demographics by Family Households with Children
Demographics Similar to Immigrants from the Azores by Family Households with Children
In terms of family households with children, the demographic groups most similar to Immigrants from the Azores are Indonesian (28.1%, a difference of 0.0%), Immigrants from Kenya (28.1%, a difference of 0.010%), Immigrants from Oceania (28.1%, a difference of 0.020%), Chilean (28.1%, a difference of 0.050%), and Assyrian/Chaldean/Syriac (28.1%, a difference of 0.050%).
| Demographics | Rating | Rank | Family Households with Children |
| Chickasaw | 99.4 /100 | #92 | Exceptional 28.2% |
| Panamanians | 99.3 /100 | #93 | Exceptional 28.2% |
| Immigrants | Colombia | 99.2 /100 | #94 | Exceptional 28.2% |
| Immigrants | Nicaragua | 99.1 /100 | #95 | Exceptional 28.2% |
| Ute | 99.1 /100 | #96 | Exceptional 28.2% |
| Chileans | 98.9 /100 | #97 | Exceptional 28.1% |
| Immigrants | Kenya | 98.9 /100 | #98 | Exceptional 28.1% |
| Immigrants | Azores | 98.8 /100 | #99 | Exceptional 28.1% |
| Indonesians | 98.8 /100 | #100 | Exceptional 28.1% |
| Immigrants | Oceania | 98.8 /100 | #101 | Exceptional 28.1% |
| Assyrians/Chaldeans/Syriacs | 98.7 /100 | #102 | Exceptional 28.1% |
| Palestinians | 98.5 /100 | #103 | Exceptional 28.1% |
| Sioux | 98.3 /100 | #104 | Exceptional 28.1% |
| Choctaw | 98.3 /100 | #105 | Exceptional 28.1% |
| Immigrants | South America | 98.0 /100 | #106 | Exceptional 28.0% |
Demographics Similar to Immigrants from Cameroon by Family Households with Children
In terms of family households with children, the demographic groups most similar to Immigrants from Cameroon are Korean (29.2%, a difference of 0.14%), Immigrants from Venezuela (29.3%, a difference of 0.27%), Immigrants from Sierra Leone (29.3%, a difference of 0.28%), Yaqui (29.1%, a difference of 0.29%), and Central American (29.1%, a difference of 0.30%).
| Demographics | Rating | Rank | Family Households with Children |
| Yuman | 100.0 /100 | #30 | Exceptional 29.5% |
| Japanese | 100.0 /100 | #31 | Exceptional 29.4% |
| Immigrants | Yemen | 100.0 /100 | #32 | Exceptional 29.4% |
| Venezuelans | 100.0 /100 | #33 | Exceptional 29.4% |
| Immigrants | Bolivia | 100.0 /100 | #34 | Exceptional 29.3% |
| Immigrants | Sierra Leone | 100.0 /100 | #35 | Exceptional 29.3% |
| Immigrants | Venezuela | 100.0 /100 | #36 | Exceptional 29.3% |
| Immigrants | Cameroon | 100.0 /100 | #37 | Exceptional 29.2% |
| Koreans | 100.0 /100 | #38 | Exceptional 29.2% |
| Yaqui | 100.0 /100 | #39 | Exceptional 29.1% |
| Central Americans | 100.0 /100 | #40 | Exceptional 29.1% |
| Immigrants | South Eastern Asia | 100.0 /100 | #41 | Exceptional 29.1% |
| Spanish American Indians | 100.0 /100 | #42 | Exceptional 29.1% |
| Asians | 100.0 /100 | #43 | Exceptional 29.1% |
| Immigrants | Taiwan | 100.0 /100 | #44 | Exceptional 29.0% |