Immigrants from Armenia vs Alaska Native Married-couple Households
COMPARE
Immigrants from Armenia
Alaska Native
Married-couple Households
Married-couple Households Comparison
Immigrants from Armenia
Alaska Natives
44.3%
MARRIED-COUPLE HOUSEHOLDS
0.7/ 100
METRIC RATING
244th/ 347
METRIC RANK
45.6%
MARRIED-COUPLE HOUSEHOLDS
13.0/ 100
METRIC RATING
203rd/ 347
METRIC RANK
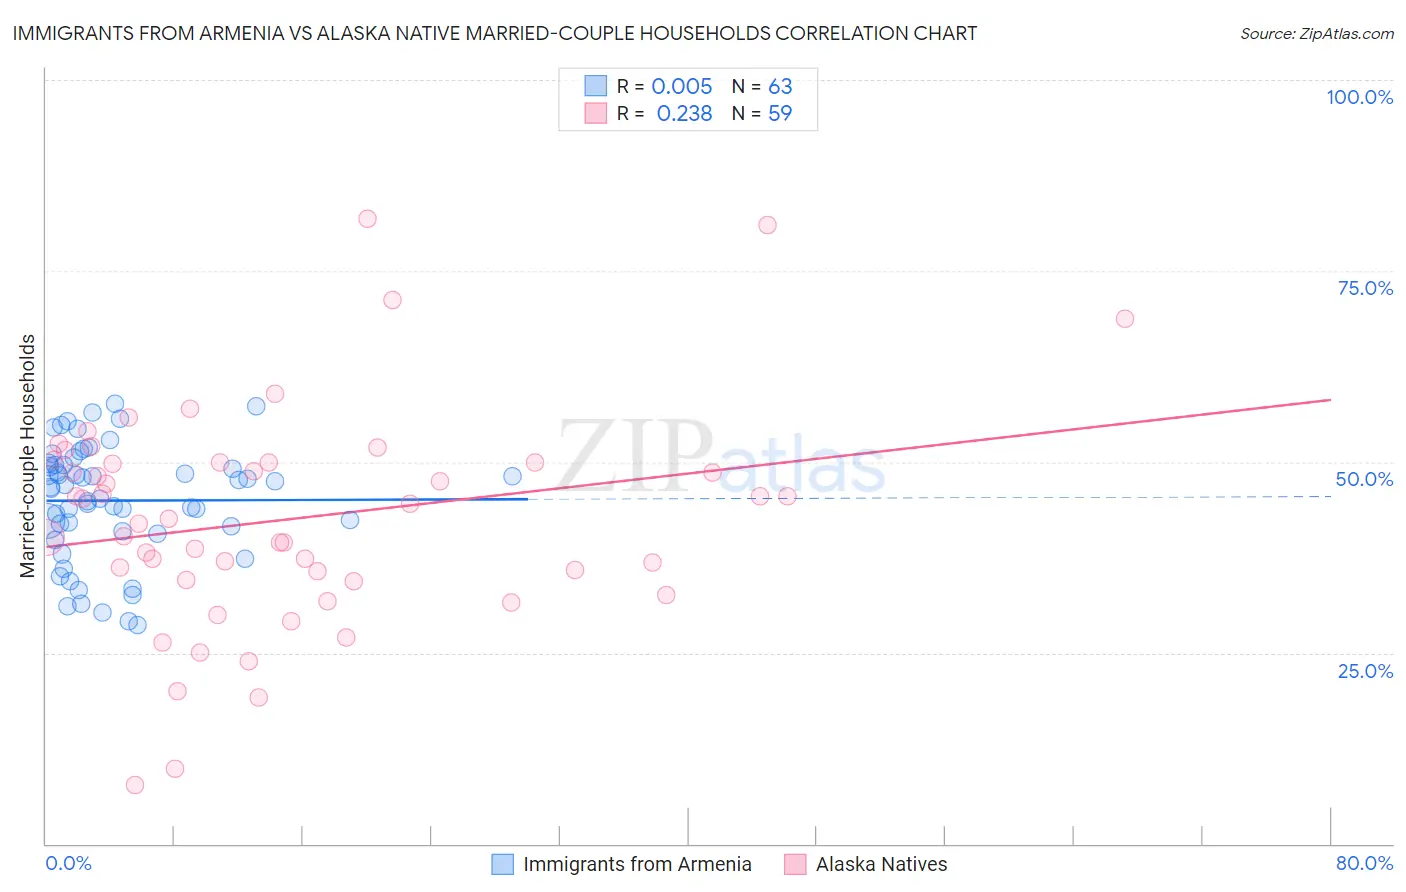
Immigrants from Armenia vs Alaska Native Married-couple Households Correlation Chart
The statistical analysis conducted on geographies consisting of 97,683,198 people shows no correlation between the proportion of Immigrants from Armenia and percentage of married-couple family households in the United States with a correlation coefficient (R) of 0.005 and weighted average of 44.3%. Similarly, the statistical analysis conducted on geographies consisting of 76,754,509 people shows a weak positive correlation between the proportion of Alaska Natives and percentage of married-couple family households in the United States with a correlation coefficient (R) of 0.238 and weighted average of 45.6%, a difference of 3.0%.
Married-couple Households Correlation Summary
| Measurement | Immigrants from Armenia | Alaska Native |
| Minimum | 28.6% | 7.7% |
| Maximum | 57.7% | 81.8% |
| Range | 29.0% | 74.1% |
| Mean | 44.9% | 42.5% |
| Median | 46.7% | 42.6% |
| Interquartile 25% (IQ1) | 41.0% | 34.6% |
| Interquartile 75% (IQ3) | 49.6% | 50.0% |
| Interquartile Range (IQR) | 8.7% | 15.4% |
| Standard Deviation (Sample) | 7.5% | 14.3% |
| Standard Deviation (Population) | 7.4% | 14.1% |
Similar Demographics by Married-couple Households
Demographics Similar to Immigrants from Armenia by Married-couple Households
In terms of married-couple households, the demographic groups most similar to Immigrants from Armenia are Immigrants from El Salvador (44.3%, a difference of 0.010%), Immigrants from Cuba (44.2%, a difference of 0.16%), Immigrants from Morocco (44.2%, a difference of 0.16%), Immigrants from Saudi Arabia (44.4%, a difference of 0.28%), and Immigrants from Albania (44.4%, a difference of 0.35%).
| Demographics | Rating | Rank | Married-couple Households |
| Comanche | 1.2 /100 | #237 | Tragic 44.5% |
| Immigrants | Uruguay | 1.1 /100 | #238 | Tragic 44.5% |
| Spanish Americans | 1.1 /100 | #239 | Tragic 44.5% |
| Ute | 1.0 /100 | #240 | Tragic 44.4% |
| Immigrants | Bosnia and Herzegovina | 1.0 /100 | #241 | Tragic 44.4% |
| Immigrants | Albania | 1.0 /100 | #242 | Tragic 44.4% |
| Immigrants | Saudi Arabia | 0.9 /100 | #243 | Tragic 44.4% |
| Immigrants | Armenia | 0.7 /100 | #244 | Tragic 44.3% |
| Immigrants | El Salvador | 0.7 /100 | #245 | Tragic 44.3% |
| Immigrants | Cuba | 0.6 /100 | #246 | Tragic 44.2% |
| Immigrants | Morocco | 0.6 /100 | #247 | Tragic 44.2% |
| Yup'ik | 0.4 /100 | #248 | Tragic 44.1% |
| Immigrants | Kenya | 0.4 /100 | #249 | Tragic 44.1% |
| French American Indians | 0.4 /100 | #250 | Tragic 44.1% |
| German Russians | 0.4 /100 | #251 | Tragic 44.0% |
Demographics Similar to Alaska Natives by Married-couple Households
In terms of married-couple households, the demographic groups most similar to Alaska Natives are Aleut (45.6%, a difference of 0.050%), Immigrants from Central America (45.7%, a difference of 0.090%), Nepalese (45.6%, a difference of 0.10%), Immigrants from Serbia (45.7%, a difference of 0.17%), and Potawatomi (45.7%, a difference of 0.20%).
| Demographics | Rating | Rank | Married-couple Households |
| Immigrants | South America | 22.2 /100 | #196 | Fair 45.9% |
| Cambodians | 21.3 /100 | #197 | Fair 45.9% |
| Ottawa | 19.4 /100 | #198 | Poor 45.8% |
| Carpatho Rusyns | 15.7 /100 | #199 | Poor 45.7% |
| Potawatomi | 15.6 /100 | #200 | Poor 45.7% |
| Immigrants | Serbia | 15.2 /100 | #201 | Poor 45.7% |
| Immigrants | Central America | 14.2 /100 | #202 | Poor 45.7% |
| Alaska Natives | 13.0 /100 | #203 | Poor 45.6% |
| Aleuts | 12.5 /100 | #204 | Poor 45.6% |
| Nepalese | 11.9 /100 | #205 | Poor 45.6% |
| Uruguayans | 10.4 /100 | #206 | Poor 45.5% |
| Immigrants | France | 8.8 /100 | #207 | Tragic 45.4% |
| Hispanics or Latinos | 8.7 /100 | #208 | Tragic 45.4% |
| Immigrants | Uzbekistan | 8.4 /100 | #209 | Tragic 45.4% |
| Cubans | 7.7 /100 | #210 | Tragic 45.4% |