Immigrants from Argentina vs Pima Family Households with Children
COMPARE
Immigrants from Argentina
Pima
Family Households with Children
Family Households with Children Comparison
Immigrants from Argentina
Pima
27.5%
FAMILY HOUSEHOLDS WITH CHILDREN
52.2/ 100
METRIC RATING
173rd/ 347
METRIC RANK
27.1%
FAMILY HOUSEHOLDS WITH CHILDREN
9.2/ 100
METRIC RATING
223rd/ 347
METRIC RANK
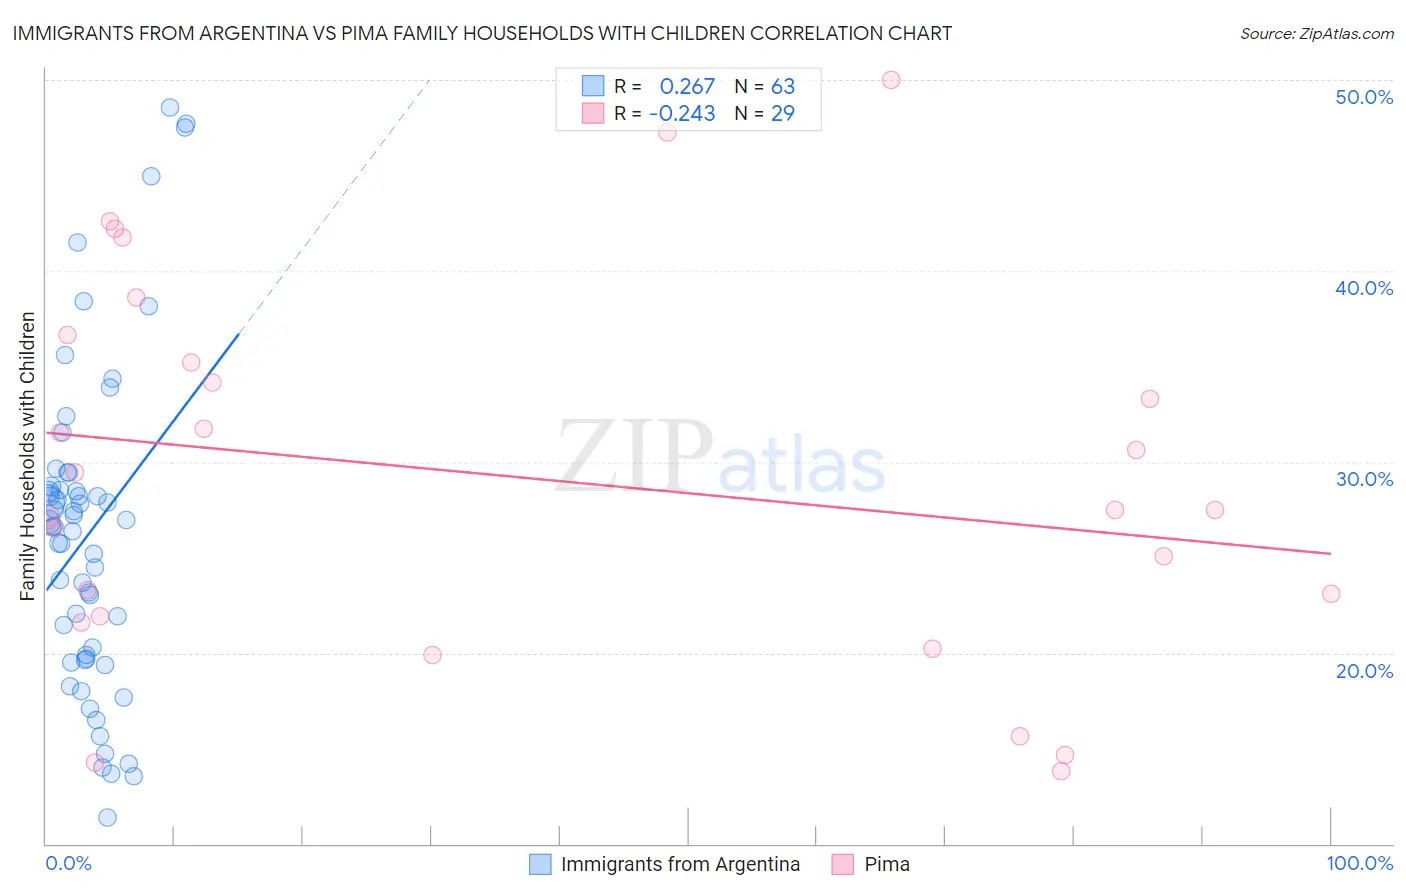
Immigrants from Argentina vs Pima Family Households with Children Correlation Chart
The statistical analysis conducted on geographies consisting of 264,229,087 people shows a weak positive correlation between the proportion of Immigrants from Argentina and percentage of family households with children in the United States with a correlation coefficient (R) of 0.267 and weighted average of 27.5%. Similarly, the statistical analysis conducted on geographies consisting of 61,534,200 people shows a weak negative correlation between the proportion of Pima and percentage of family households with children in the United States with a correlation coefficient (R) of -0.243 and weighted average of 27.1%, a difference of 1.3%.
Family Households with Children Correlation Summary
| Measurement | Immigrants from Argentina | Pima |
| Minimum | 11.4% | 13.8% |
| Maximum | 48.6% | 50.0% |
| Range | 37.2% | 36.2% |
| Mean | 26.2% | 29.2% |
| Median | 26.6% | 27.5% |
| Interquartile 25% (IQ1) | 19.7% | 21.8% |
| Interquartile 75% (IQ3) | 28.7% | 35.9% |
| Interquartile Range (IQR) | 9.0% | 14.2% |
| Standard Deviation (Sample) | 8.5% | 9.9% |
| Standard Deviation (Population) | 8.4% | 9.7% |
Similar Demographics by Family Households with Children
Demographics Similar to Immigrants from Argentina by Family Households with Children
In terms of family households with children, the demographic groups most similar to Immigrants from Argentina are Israeli (27.5%, a difference of 0.040%), Blackfeet (27.5%, a difference of 0.050%), White/Caucasian (27.4%, a difference of 0.050%), British (27.4%, a difference of 0.050%), and Immigrants from China (27.4%, a difference of 0.060%).
| Demographics | Rating | Rank | Family Households with Children |
| Immigrants | Nonimmigrants | 61.2 /100 | #166 | Good 27.5% |
| Dominicans | 61.1 /100 | #167 | Good 27.5% |
| Immigrants | Kuwait | 60.9 /100 | #168 | Good 27.5% |
| Seminole | 56.9 /100 | #169 | Average 27.5% |
| Cherokee | 56.7 /100 | #170 | Average 27.5% |
| Blackfeet | 54.3 /100 | #171 | Average 27.5% |
| Israelis | 53.9 /100 | #172 | Average 27.5% |
| Immigrants | Argentina | 52.2 /100 | #173 | Average 27.5% |
| Whites/Caucasians | 50.0 /100 | #174 | Average 27.4% |
| British | 49.9 /100 | #175 | Average 27.4% |
| Immigrants | China | 49.6 /100 | #176 | Average 27.4% |
| Ugandans | 49.2 /100 | #177 | Average 27.4% |
| Spanish Americans | 48.9 /100 | #178 | Average 27.4% |
| Turks | 46.9 /100 | #179 | Average 27.4% |
| Immigrants | Turkey | 46.9 /100 | #180 | Average 27.4% |
Demographics Similar to Pima by Family Households with Children
In terms of family households with children, the demographic groups most similar to Pima are Paraguayan (27.1%, a difference of 0.010%), New Zealander (27.1%, a difference of 0.030%), German (27.1%, a difference of 0.030%), Austrian (27.1%, a difference of 0.050%), and Immigrants from Japan (27.1%, a difference of 0.090%).
| Demographics | Rating | Rank | Family Households with Children |
| Cubans | 12.2 /100 | #216 | Poor 27.1% |
| U.S. Virgin Islanders | 12.1 /100 | #217 | Poor 27.1% |
| Greeks | 11.4 /100 | #218 | Poor 27.1% |
| Immigrants | Japan | 10.7 /100 | #219 | Poor 27.1% |
| Austrians | 9.9 /100 | #220 | Tragic 27.1% |
| New Zealanders | 9.6 /100 | #221 | Tragic 27.1% |
| Paraguayans | 9.4 /100 | #222 | Tragic 27.1% |
| Pima | 9.2 /100 | #223 | Tragic 27.1% |
| Germans | 8.7 /100 | #224 | Tragic 27.1% |
| Canadians | 7.5 /100 | #225 | Tragic 27.1% |
| Czechoslovakians | 6.6 /100 | #226 | Tragic 27.0% |
| Tsimshian | 6.6 /100 | #227 | Tragic 27.0% |
| Scottish | 6.5 /100 | #228 | Tragic 27.0% |
| Immigrants | Caribbean | 6.3 /100 | #229 | Tragic 27.0% |
| Bulgarians | 5.8 /100 | #230 | Tragic 27.0% |