Hopi vs Alaskan Athabascan Single Mother Households
COMPARE
Hopi
Alaskan Athabascan
Single Mother Households
Single Mother Households Comparison
Hopi
Alaskan Athabascans
8.5%
SINGLE MOTHER HOUSEHOLDS
0.0/ 100
METRIC RATING
329th/ 347
METRIC RANK
7.3%
SINGLE MOTHER HOUSEHOLDS
0.3/ 100
METRIC RATING
252nd/ 347
METRIC RANK
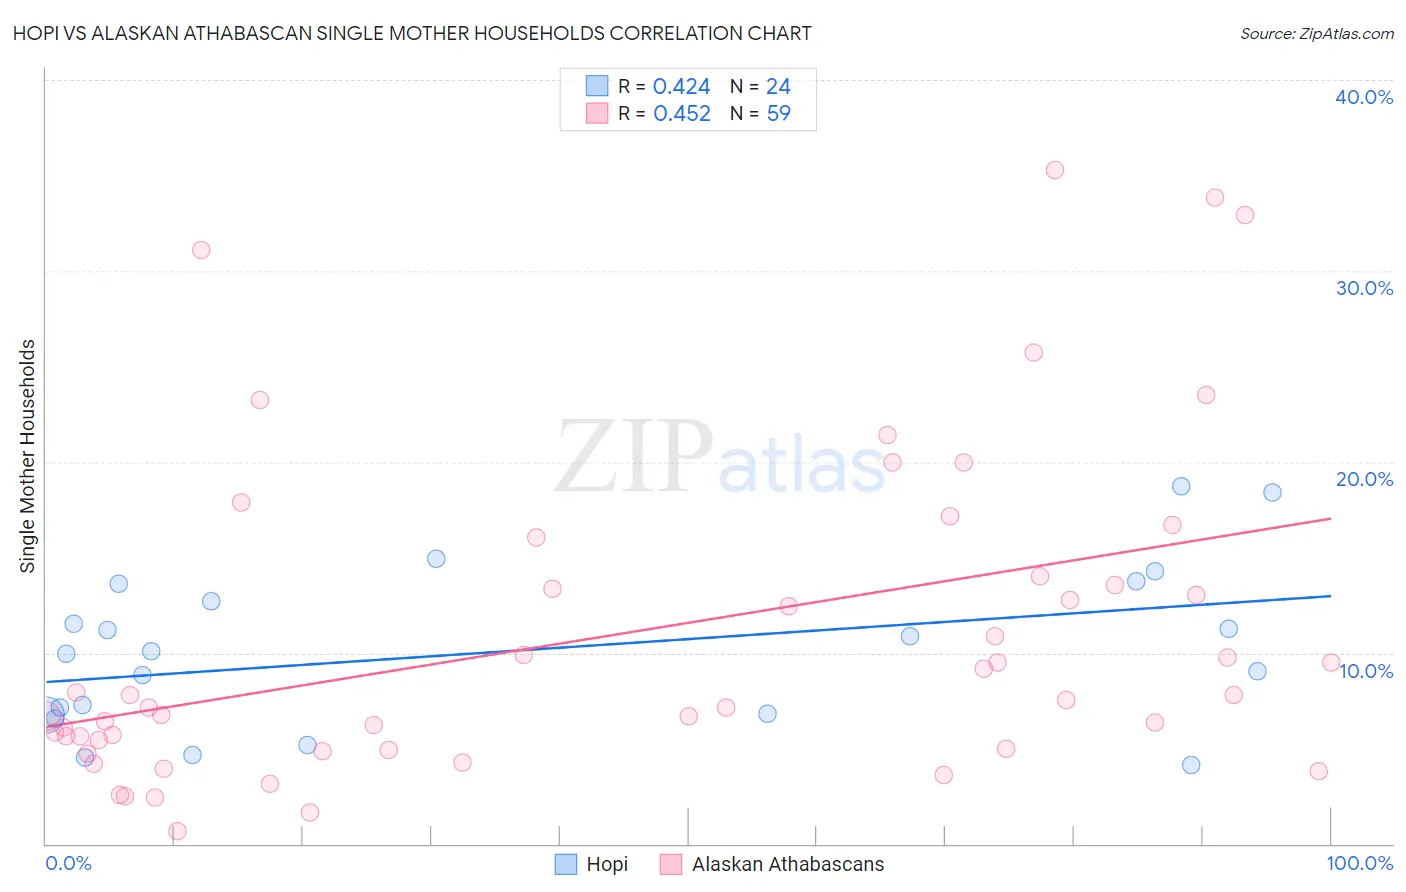
Hopi vs Alaskan Athabascan Single Mother Households Correlation Chart
The statistical analysis conducted on geographies consisting of 74,699,653 people shows a moderate positive correlation between the proportion of Hopi and percentage of single mother households in the United States with a correlation coefficient (R) of 0.424 and weighted average of 8.5%. Similarly, the statistical analysis conducted on geographies consisting of 45,772,365 people shows a moderate positive correlation between the proportion of Alaskan Athabascans and percentage of single mother households in the United States with a correlation coefficient (R) of 0.452 and weighted average of 7.3%, a difference of 16.0%.
Single Mother Households Correlation Summary
| Measurement | Hopi | Alaskan Athabascan |
| Minimum | 4.1% | 0.67% |
| Maximum | 18.7% | 35.3% |
| Range | 14.6% | 34.6% |
| Mean | 10.1% | 10.9% |
| Median | 10.0% | 7.5% |
| Interquartile 25% (IQ1) | 6.8% | 5.0% |
| Interquartile 75% (IQ3) | 13.1% | 14.0% |
| Interquartile Range (IQR) | 6.4% | 9.0% |
| Standard Deviation (Sample) | 4.2% | 8.5% |
| Standard Deviation (Population) | 4.1% | 8.4% |
Similar Demographics by Single Mother Households
Demographics Similar to Hopi by Single Mother Households
In terms of single mother households, the demographic groups most similar to Hopi are Inupiat (8.5%, a difference of 0.11%), Sioux (8.5%, a difference of 0.11%), Yakama (8.4%, a difference of 0.75%), Immigrants from Haiti (8.4%, a difference of 0.92%), and British West Indian (8.4%, a difference of 1.1%).
| Demographics | Rating | Rank | Single Mother Households |
| Pima | 0.0 /100 | #322 | Tragic 8.3% |
| Haitians | 0.0 /100 | #323 | Tragic 8.3% |
| Immigrants | Jamaica | 0.0 /100 | #324 | Tragic 8.4% |
| Immigrants | Caribbean | 0.0 /100 | #325 | Tragic 8.4% |
| British West Indians | 0.0 /100 | #326 | Tragic 8.4% |
| Immigrants | Haiti | 0.0 /100 | #327 | Tragic 8.4% |
| Yakama | 0.0 /100 | #328 | Tragic 8.4% |
| Hopi | 0.0 /100 | #329 | Tragic 8.5% |
| Inupiat | 0.0 /100 | #330 | Tragic 8.5% |
| Sioux | 0.0 /100 | #331 | Tragic 8.5% |
| U.S. Virgin Islanders | 0.0 /100 | #332 | Tragic 8.6% |
| Liberians | 0.0 /100 | #333 | Tragic 8.6% |
| Immigrants | Liberia | 0.0 /100 | #334 | Tragic 8.7% |
| Immigrants | Dominica | 0.0 /100 | #335 | Tragic 8.7% |
| Puerto Ricans | 0.0 /100 | #336 | Tragic 8.7% |
Demographics Similar to Alaskan Athabascans by Single Mother Households
In terms of single mother households, the demographic groups most similar to Alaskan Athabascans are Malaysian (7.3%, a difference of 0.020%), Immigrants from Africa (7.3%, a difference of 0.37%), Bermudan (7.3%, a difference of 0.38%), Cajun (7.3%, a difference of 0.38%), and Immigrants from Ecuador (7.3%, a difference of 0.44%).
| Demographics | Rating | Rank | Single Mother Households |
| Immigrants | Cambodia | 0.5 /100 | #245 | Tragic 7.2% |
| Nicaraguans | 0.5 /100 | #246 | Tragic 7.2% |
| Dutch West Indians | 0.4 /100 | #247 | Tragic 7.3% |
| Spanish American Indians | 0.4 /100 | #248 | Tragic 7.3% |
| Bermudans | 0.4 /100 | #249 | Tragic 7.3% |
| Immigrants | Africa | 0.4 /100 | #250 | Tragic 7.3% |
| Malaysians | 0.3 /100 | #251 | Tragic 7.3% |
| Alaskan Athabascans | 0.3 /100 | #252 | Tragic 7.3% |
| Cajuns | 0.3 /100 | #253 | Tragic 7.3% |
| Immigrants | Ecuador | 0.3 /100 | #254 | Tragic 7.3% |
| Mexican American Indians | 0.2 /100 | #255 | Tragic 7.4% |
| Seminole | 0.2 /100 | #256 | Tragic 7.4% |
| Alaska Natives | 0.2 /100 | #257 | Tragic 7.4% |
| Pueblo | 0.2 /100 | #258 | Tragic 7.4% |
| Immigrants | Yemen | 0.2 /100 | #259 | Tragic 7.4% |