Hopi vs Immigrants from Armenia Single Mother Households
COMPARE
Hopi
Immigrants from Armenia
Single Mother Households
Single Mother Households Comparison
Hopi
Immigrants from Armenia
8.5%
SINGLE MOTHER HOUSEHOLDS
0.0/ 100
METRIC RATING
329th/ 347
METRIC RANK
5.2%
SINGLE MOTHER HOUSEHOLDS
99.9/ 100
METRIC RATING
18th/ 347
METRIC RANK
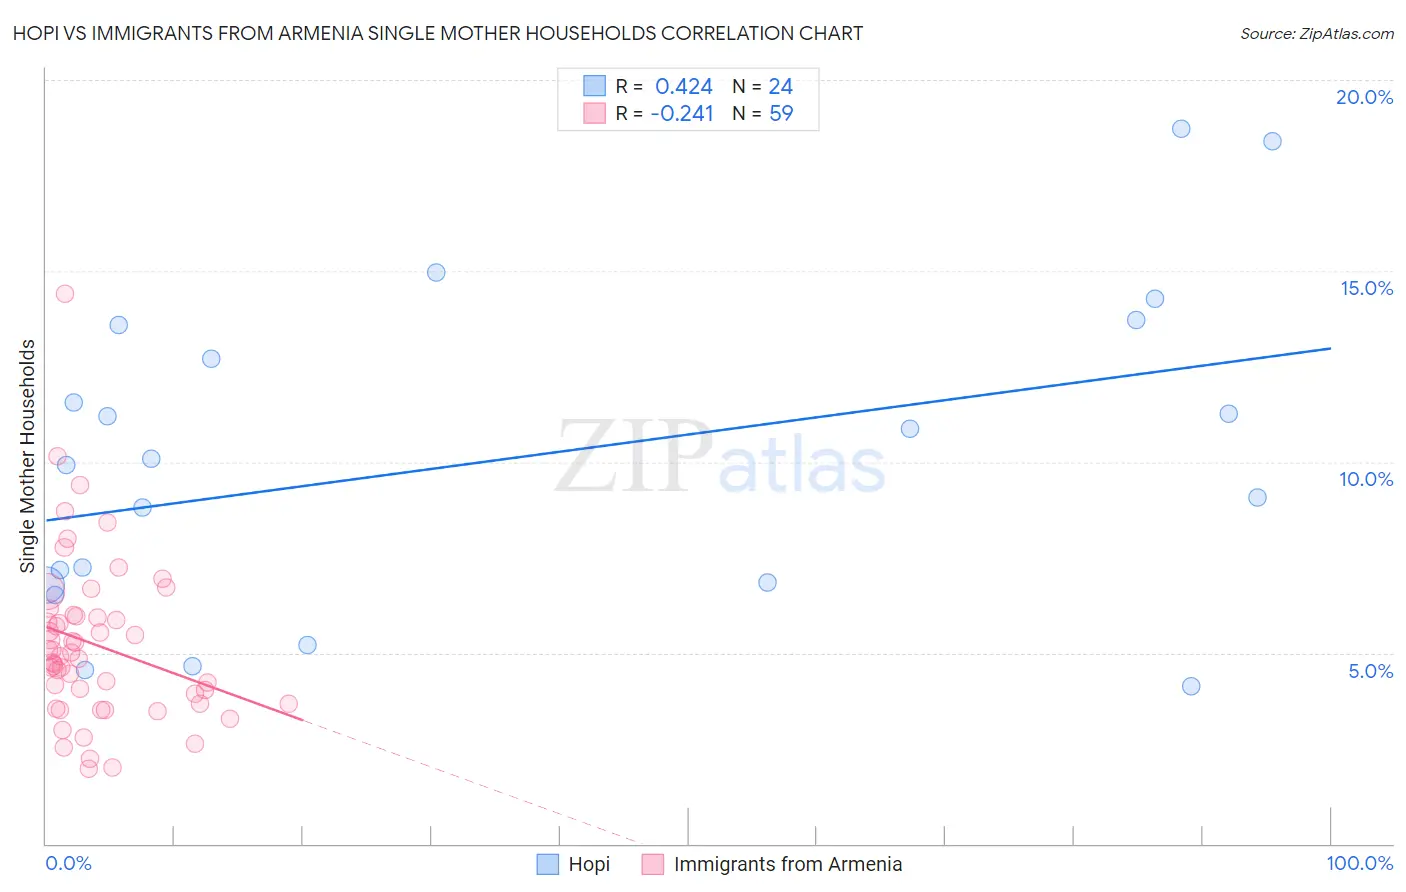
Hopi vs Immigrants from Armenia Single Mother Households Correlation Chart
The statistical analysis conducted on geographies consisting of 74,699,653 people shows a moderate positive correlation between the proportion of Hopi and percentage of single mother households in the United States with a correlation coefficient (R) of 0.424 and weighted average of 8.5%. Similarly, the statistical analysis conducted on geographies consisting of 97,664,769 people shows a weak negative correlation between the proportion of Immigrants from Armenia and percentage of single mother households in the United States with a correlation coefficient (R) of -0.241 and weighted average of 5.2%, a difference of 64.3%.
Single Mother Households Correlation Summary
| Measurement | Hopi | Immigrants from Armenia |
| Minimum | 4.1% | 2.0% |
| Maximum | 18.7% | 14.4% |
| Range | 14.6% | 12.4% |
| Mean | 10.1% | 5.2% |
| Median | 10.0% | 4.9% |
| Interquartile 25% (IQ1) | 6.8% | 3.7% |
| Interquartile 75% (IQ3) | 13.1% | 6.0% |
| Interquartile Range (IQR) | 6.4% | 2.3% |
| Standard Deviation (Sample) | 4.2% | 2.2% |
| Standard Deviation (Population) | 4.1% | 2.1% |
Similar Demographics by Single Mother Households
Demographics Similar to Hopi by Single Mother Households
In terms of single mother households, the demographic groups most similar to Hopi are Inupiat (8.5%, a difference of 0.11%), Sioux (8.5%, a difference of 0.11%), Yakama (8.4%, a difference of 0.75%), Immigrants from Haiti (8.4%, a difference of 0.92%), and British West Indian (8.4%, a difference of 1.1%).
| Demographics | Rating | Rank | Single Mother Households |
| Pima | 0.0 /100 | #322 | Tragic 8.3% |
| Haitians | 0.0 /100 | #323 | Tragic 8.3% |
| Immigrants | Jamaica | 0.0 /100 | #324 | Tragic 8.4% |
| Immigrants | Caribbean | 0.0 /100 | #325 | Tragic 8.4% |
| British West Indians | 0.0 /100 | #326 | Tragic 8.4% |
| Immigrants | Haiti | 0.0 /100 | #327 | Tragic 8.4% |
| Yakama | 0.0 /100 | #328 | Tragic 8.4% |
| Hopi | 0.0 /100 | #329 | Tragic 8.5% |
| Inupiat | 0.0 /100 | #330 | Tragic 8.5% |
| Sioux | 0.0 /100 | #331 | Tragic 8.5% |
| U.S. Virgin Islanders | 0.0 /100 | #332 | Tragic 8.6% |
| Liberians | 0.0 /100 | #333 | Tragic 8.6% |
| Immigrants | Liberia | 0.0 /100 | #334 | Tragic 8.7% |
| Immigrants | Dominica | 0.0 /100 | #335 | Tragic 8.7% |
| Puerto Ricans | 0.0 /100 | #336 | Tragic 8.7% |
Demographics Similar to Immigrants from Armenia by Single Mother Households
In terms of single mother households, the demographic groups most similar to Immigrants from Armenia are Chinese (5.2%, a difference of 0.11%), Maltese (5.2%, a difference of 0.57%), Eastern European (5.2%, a difference of 0.63%), Soviet Union (5.1%, a difference of 0.78%), and Indian (Asian) (5.1%, a difference of 0.99%).
| Demographics | Rating | Rank | Single Mother Households |
| Immigrants | China | 99.9 /100 | #11 | Exceptional 5.1% |
| Cypriots | 99.9 /100 | #12 | Exceptional 5.1% |
| Immigrants | India | 99.9 /100 | #13 | Exceptional 5.1% |
| Immigrants | Australia | 99.9 /100 | #14 | Exceptional 5.1% |
| Immigrants | Eastern Asia | 99.9 /100 | #15 | Exceptional 5.1% |
| Indians (Asian) | 99.9 /100 | #16 | Exceptional 5.1% |
| Soviet Union | 99.9 /100 | #17 | Exceptional 5.1% |
| Immigrants | Armenia | 99.9 /100 | #18 | Exceptional 5.2% |
| Chinese | 99.9 /100 | #19 | Exceptional 5.2% |
| Maltese | 99.9 /100 | #20 | Exceptional 5.2% |
| Eastern Europeans | 99.8 /100 | #21 | Exceptional 5.2% |
| Thais | 99.8 /100 | #22 | Exceptional 5.2% |
| Immigrants | Austria | 99.8 /100 | #23 | Exceptional 5.2% |
| Armenians | 99.8 /100 | #24 | Exceptional 5.2% |
| Immigrants | Japan | 99.8 /100 | #25 | Exceptional 5.2% |