Immigrants from the Azores vs Alaskan Athabascan Single Mother Households
COMPARE
Immigrants from the Azores
Alaskan Athabascan
Single Mother Households
Single Mother Households Comparison
Immigrants from the Azores
Alaskan Athabascans
7.5%
SINGLE MOTHER HOUSEHOLDS
0.1/ 100
METRIC RATING
272nd/ 347
METRIC RANK
7.3%
SINGLE MOTHER HOUSEHOLDS
0.3/ 100
METRIC RATING
252nd/ 347
METRIC RANK
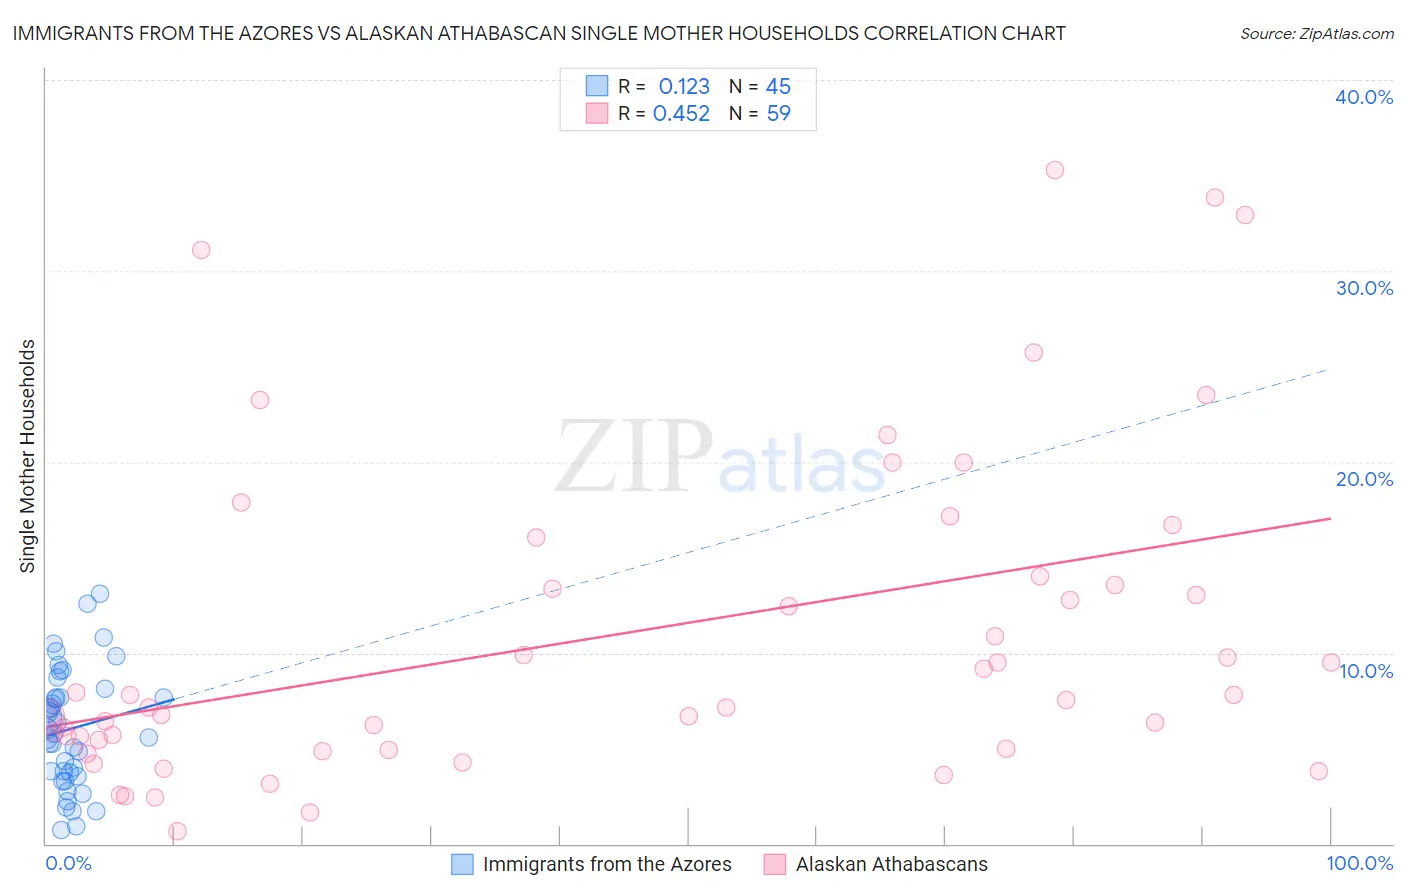
Immigrants from the Azores vs Alaskan Athabascan Single Mother Households Correlation Chart
The statistical analysis conducted on geographies consisting of 46,218,711 people shows a poor positive correlation between the proportion of Immigrants from the Azores and percentage of single mother households in the United States with a correlation coefficient (R) of 0.123 and weighted average of 7.5%. Similarly, the statistical analysis conducted on geographies consisting of 45,772,365 people shows a moderate positive correlation between the proportion of Alaskan Athabascans and percentage of single mother households in the United States with a correlation coefficient (R) of 0.452 and weighted average of 7.3%, a difference of 3.1%.
Single Mother Households Correlation Summary
| Measurement | Immigrants from the Azores | Alaskan Athabascan |
| Minimum | 0.74% | 0.67% |
| Maximum | 13.1% | 35.3% |
| Range | 12.3% | 34.6% |
| Mean | 6.0% | 10.9% |
| Median | 5.8% | 7.5% |
| Interquartile 25% (IQ1) | 3.6% | 5.0% |
| Interquartile 75% (IQ3) | 7.9% | 14.0% |
| Interquartile Range (IQR) | 4.3% | 9.0% |
| Standard Deviation (Sample) | 3.1% | 8.5% |
| Standard Deviation (Population) | 3.0% | 8.4% |
Demographics Similar to Immigrants from the Azores and Alaskan Athabascans by Single Mother Households
In terms of single mother households, the demographic groups most similar to Immigrants from the Azores are Salvadoran (7.5%, a difference of 0.0%), Immigrants from Cuba (7.5%, a difference of 0.090%), Somali (7.5%, a difference of 0.25%), Indonesian (7.5%, a difference of 0.67%), and Blackfeet (7.5%, a difference of 0.71%). Similarly, the demographic groups most similar to Alaskan Athabascans are Cajun (7.3%, a difference of 0.38%), Immigrants from Ecuador (7.3%, a difference of 0.44%), Mexican American Indian (7.4%, a difference of 0.81%), Seminole (7.4%, a difference of 1.2%), and Alaska Native (7.4%, a difference of 1.2%).
| Demographics | Rating | Rank | Single Mother Households |
| Alaskan Athabascans | 0.3 /100 | #252 | Tragic 7.3% |
| Cajuns | 0.3 /100 | #253 | Tragic 7.3% |
| Immigrants | Ecuador | 0.3 /100 | #254 | Tragic 7.3% |
| Mexican American Indians | 0.2 /100 | #255 | Tragic 7.4% |
| Seminole | 0.2 /100 | #256 | Tragic 7.4% |
| Alaska Natives | 0.2 /100 | #257 | Tragic 7.4% |
| Pueblo | 0.2 /100 | #258 | Tragic 7.4% |
| Immigrants | Yemen | 0.2 /100 | #259 | Tragic 7.4% |
| Immigrants | Zaire | 0.2 /100 | #260 | Tragic 7.4% |
| Japanese | 0.2 /100 | #261 | Tragic 7.4% |
| Immigrants | Somalia | 0.2 /100 | #262 | Tragic 7.4% |
| Immigrants | Nicaragua | 0.2 /100 | #263 | Tragic 7.4% |
| Yaqui | 0.1 /100 | #264 | Tragic 7.4% |
| Crow | 0.1 /100 | #265 | Tragic 7.4% |
| Nepalese | 0.1 /100 | #266 | Tragic 7.5% |
| Blackfeet | 0.1 /100 | #267 | Tragic 7.5% |
| Indonesians | 0.1 /100 | #268 | Tragic 7.5% |
| Somalis | 0.1 /100 | #269 | Tragic 7.5% |
| Immigrants | Cuba | 0.1 /100 | #270 | Tragic 7.5% |
| Salvadorans | 0.1 /100 | #271 | Tragic 7.5% |
| Immigrants | Azores | 0.1 /100 | #272 | Tragic 7.5% |