Guatemalan vs Dominican Married-couple Households
COMPARE
Guatemalan
Dominican
Married-couple Households
Married-couple Households Comparison
Guatemalans
Dominicans
43.3%
MARRIED-COUPLE HOUSEHOLDS
0.1/ 100
METRIC RATING
271st/ 347
METRIC RANK
38.2%
MARRIED-COUPLE HOUSEHOLDS
0.0/ 100
METRIC RATING
340th/ 347
METRIC RANK
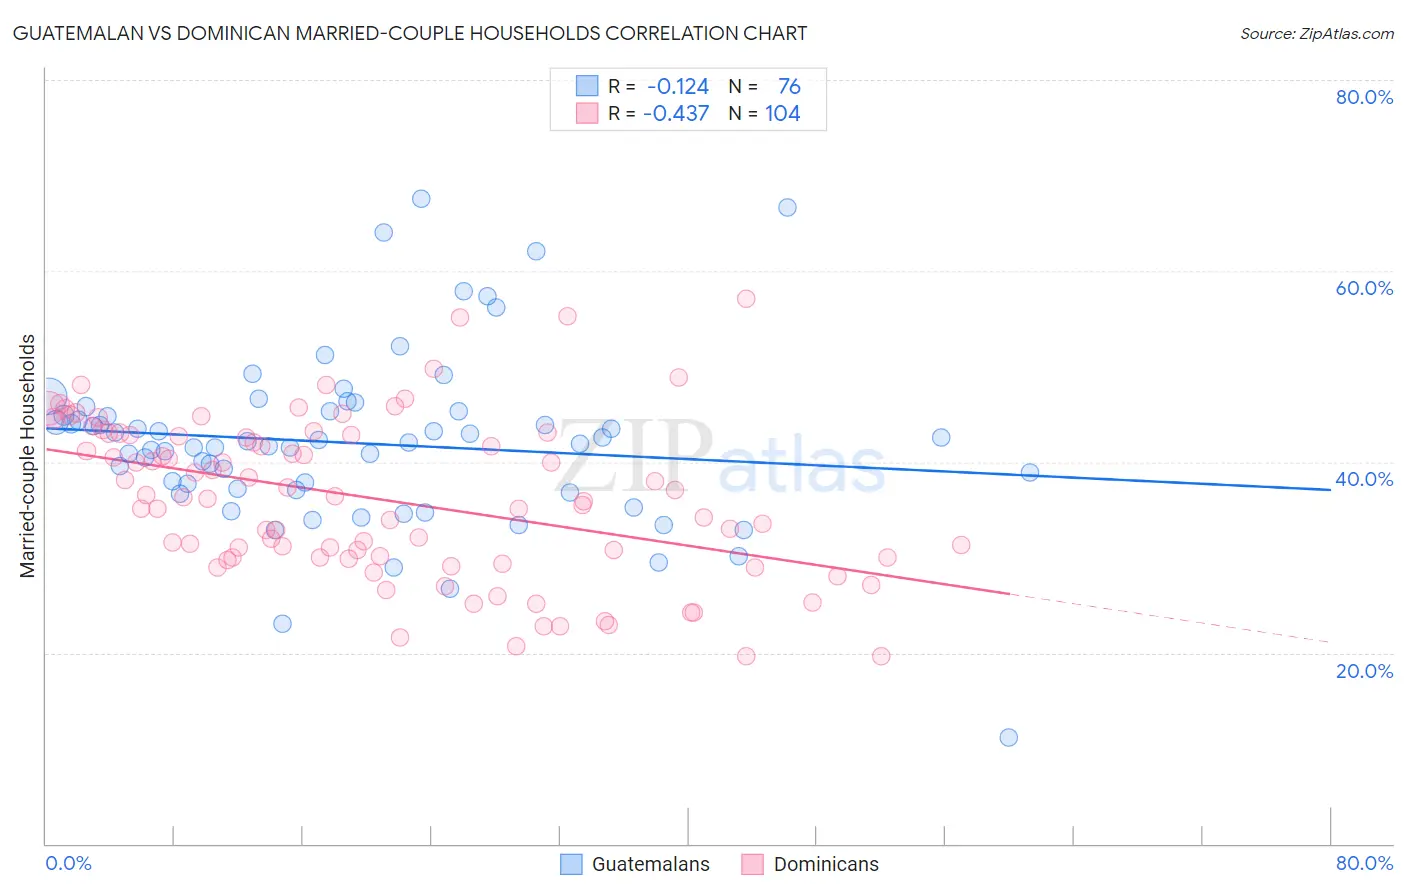
Guatemalan vs Dominican Married-couple Households Correlation Chart
The statistical analysis conducted on geographies consisting of 409,284,876 people shows a poor negative correlation between the proportion of Guatemalans and percentage of married-couple family households in the United States with a correlation coefficient (R) of -0.124 and weighted average of 43.3%. Similarly, the statistical analysis conducted on geographies consisting of 354,744,310 people shows a moderate negative correlation between the proportion of Dominicans and percentage of married-couple family households in the United States with a correlation coefficient (R) of -0.437 and weighted average of 38.2%, a difference of 13.3%.
Married-couple Households Correlation Summary
| Measurement | Guatemalan | Dominican |
| Minimum | 11.2% | 19.7% |
| Maximum | 67.5% | 57.1% |
| Range | 56.3% | 37.4% |
| Mean | 42.0% | 36.1% |
| Median | 41.9% | 36.2% |
| Interquartile 25% (IQ1) | 37.1% | 30.0% |
| Interquartile 75% (IQ3) | 45.1% | 42.8% |
| Interquartile Range (IQR) | 8.0% | 12.8% |
| Standard Deviation (Sample) | 9.1% | 8.3% |
| Standard Deviation (Population) | 9.0% | 8.3% |
Similar Demographics by Married-couple Households
Demographics Similar to Guatemalans by Married-couple Households
In terms of married-couple households, the demographic groups most similar to Guatemalans are Yuman (43.3%, a difference of 0.11%), Immigrants from Nigeria (43.2%, a difference of 0.11%), Immigrants from Sierra Leone (43.3%, a difference of 0.15%), Ethiopian (43.2%, a difference of 0.20%), and Nigerian (43.2%, a difference of 0.21%).
| Demographics | Rating | Rank | Married-couple Households |
| Bangladeshis | 0.1 /100 | #264 | Tragic 43.5% |
| Moroccans | 0.1 /100 | #265 | Tragic 43.5% |
| Ecuadorians | 0.1 /100 | #266 | Tragic 43.5% |
| Natives/Alaskans | 0.1 /100 | #267 | Tragic 43.5% |
| Immigrants | Burma/Myanmar | 0.1 /100 | #268 | Tragic 43.4% |
| Immigrants | Sierra Leone | 0.1 /100 | #269 | Tragic 43.3% |
| Yuman | 0.1 /100 | #270 | Tragic 43.3% |
| Guatemalans | 0.1 /100 | #271 | Tragic 43.3% |
| Immigrants | Nigeria | 0.1 /100 | #272 | Tragic 43.2% |
| Ethiopians | 0.1 /100 | #273 | Tragic 43.2% |
| Nigerians | 0.1 /100 | #274 | Tragic 43.2% |
| Immigrants | Bangladesh | 0.0 /100 | #275 | Tragic 43.1% |
| Immigrants | Ethiopia | 0.0 /100 | #276 | Tragic 43.1% |
| Immigrants | Eastern Africa | 0.0 /100 | #277 | Tragic 42.9% |
| Immigrants | Africa | 0.0 /100 | #278 | Tragic 42.9% |
Demographics Similar to Dominicans by Married-couple Households
In terms of married-couple households, the demographic groups most similar to Dominicans are Cape Verdean (38.1%, a difference of 0.13%), British West Indian (38.3%, a difference of 0.38%), Immigrants from Senegal (38.4%, a difference of 0.50%), Immigrants from Somalia (38.4%, a difference of 0.66%), and Tohono O'odham (37.9%, a difference of 0.73%).
| Demographics | Rating | Rank | Married-couple Households |
| Immigrants | West Indies | 0.0 /100 | #333 | Tragic 39.0% |
| Immigrants | St. Vincent and the Grenadines | 0.0 /100 | #334 | Tragic 38.7% |
| Senegalese | 0.0 /100 | #335 | Tragic 38.6% |
| Blacks/African Americans | 0.0 /100 | #336 | Tragic 38.5% |
| Immigrants | Somalia | 0.0 /100 | #337 | Tragic 38.4% |
| Immigrants | Senegal | 0.0 /100 | #338 | Tragic 38.4% |
| British West Indians | 0.0 /100 | #339 | Tragic 38.3% |
| Dominicans | 0.0 /100 | #340 | Tragic 38.2% |
| Cape Verdeans | 0.0 /100 | #341 | Tragic 38.1% |
| Tohono O'odham | 0.0 /100 | #342 | Tragic 37.9% |
| Immigrants | Grenada | 0.0 /100 | #343 | Tragic 37.5% |
| Immigrants | Dominican Republic | 0.0 /100 | #344 | Tragic 37.3% |
| Hopi | 0.0 /100 | #345 | Tragic 36.7% |
| Immigrants | Cabo Verde | 0.0 /100 | #346 | Tragic 36.2% |
| Pima | 0.0 /100 | #347 | Tragic 35.6% |