Finnish vs Uruguayan Married-couple Households
COMPARE
Finnish
Uruguayan
Married-couple Households
Married-couple Households Comparison
Finns
Uruguayans
48.1%
MARRIED-COUPLE HOUSEHOLDS
98.0/ 100
METRIC RATING
81st/ 347
METRIC RANK
45.5%
MARRIED-COUPLE HOUSEHOLDS
10.4/ 100
METRIC RATING
206th/ 347
METRIC RANK
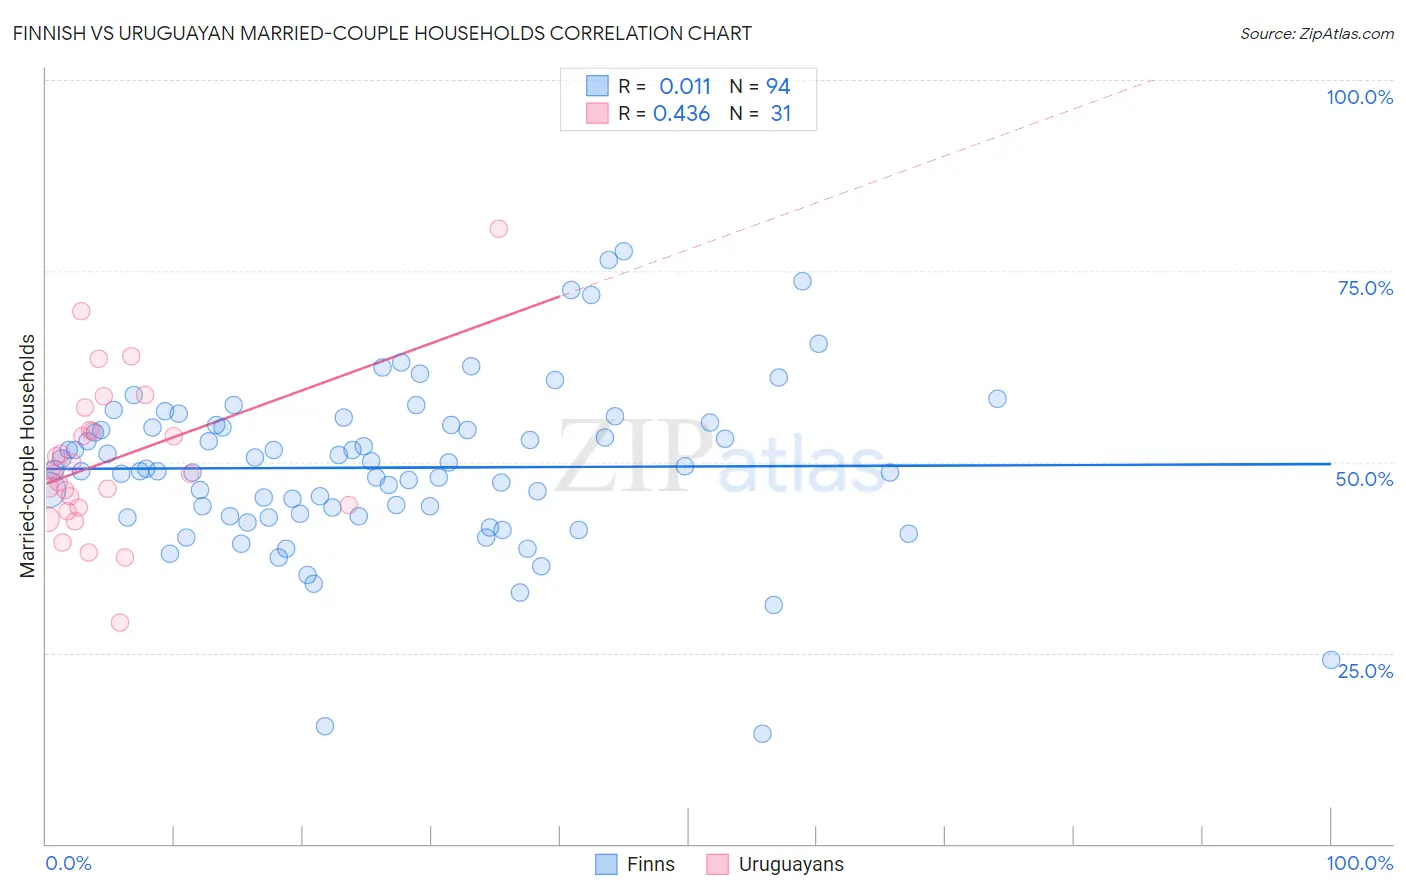
Finnish vs Uruguayan Married-couple Households Correlation Chart
The statistical analysis conducted on geographies consisting of 404,503,243 people shows no correlation between the proportion of Finns and percentage of married-couple family households in the United States with a correlation coefficient (R) of 0.011 and weighted average of 48.1%. Similarly, the statistical analysis conducted on geographies consisting of 144,757,843 people shows a moderate positive correlation between the proportion of Uruguayans and percentage of married-couple family households in the United States with a correlation coefficient (R) of 0.436 and weighted average of 45.5%, a difference of 5.8%.
Married-couple Households Correlation Summary
| Measurement | Finnish | Uruguayan |
| Minimum | 14.4% | 29.0% |
| Maximum | 77.6% | 80.5% |
| Range | 63.1% | 51.4% |
| Mean | 49.2% | 50.2% |
| Median | 49.0% | 48.5% |
| Interquartile 25% (IQ1) | 42.9% | 44.0% |
| Interquartile 75% (IQ3) | 54.8% | 54.2% |
| Interquartile Range (IQR) | 11.8% | 10.2% |
| Standard Deviation (Sample) | 10.8% | 10.2% |
| Standard Deviation (Population) | 10.8% | 10.0% |
Similar Demographics by Married-couple Households
Demographics Similar to Finns by Married-couple Households
In terms of married-couple households, the demographic groups most similar to Finns are Russian (48.2%, a difference of 0.060%), Egyptian (48.2%, a difference of 0.090%), Immigrants from Netherlands (48.2%, a difference of 0.090%), Canadian (48.2%, a difference of 0.11%), and Immigrants from Poland (48.1%, a difference of 0.14%).
| Demographics | Rating | Rank | Married-couple Households |
| Immigrants | Romania | 98.6 /100 | #74 | Exceptional 48.3% |
| Immigrants | England | 98.4 /100 | #75 | Exceptional 48.2% |
| Immigrants | Fiji | 98.4 /100 | #76 | Exceptional 48.2% |
| Canadians | 98.2 /100 | #77 | Exceptional 48.2% |
| Egyptians | 98.2 /100 | #78 | Exceptional 48.2% |
| Immigrants | Netherlands | 98.2 /100 | #79 | Exceptional 48.2% |
| Russians | 98.1 /100 | #80 | Exceptional 48.2% |
| Finns | 98.0 /100 | #81 | Exceptional 48.1% |
| Immigrants | Poland | 97.7 /100 | #82 | Exceptional 48.1% |
| Guamanians/Chamorros | 97.6 /100 | #83 | Exceptional 48.1% |
| Ukrainians | 97.6 /100 | #84 | Exceptional 48.1% |
| Immigrants | Israel | 97.4 /100 | #85 | Exceptional 48.0% |
| Belgians | 97.4 /100 | #86 | Exceptional 48.0% |
| Immigrants | Ireland | 97.3 /100 | #87 | Exceptional 48.0% |
| Afghans | 97.3 /100 | #88 | Exceptional 48.0% |
Demographics Similar to Uruguayans by Married-couple Households
In terms of married-couple households, the demographic groups most similar to Uruguayans are Nepalese (45.6%, a difference of 0.14%), Immigrants from France (45.4%, a difference of 0.18%), Hispanic or Latino (45.4%, a difference of 0.19%), Aleut (45.6%, a difference of 0.20%), and Immigrants from Uzbekistan (45.4%, a difference of 0.23%).
| Demographics | Rating | Rank | Married-couple Households |
| Carpatho Rusyns | 15.7 /100 | #199 | Poor 45.7% |
| Potawatomi | 15.6 /100 | #200 | Poor 45.7% |
| Immigrants | Serbia | 15.2 /100 | #201 | Poor 45.7% |
| Immigrants | Central America | 14.2 /100 | #202 | Poor 45.7% |
| Alaska Natives | 13.0 /100 | #203 | Poor 45.6% |
| Aleuts | 12.5 /100 | #204 | Poor 45.6% |
| Nepalese | 11.9 /100 | #205 | Poor 45.6% |
| Uruguayans | 10.4 /100 | #206 | Poor 45.5% |
| Immigrants | France | 8.8 /100 | #207 | Tragic 45.4% |
| Hispanics or Latinos | 8.7 /100 | #208 | Tragic 45.4% |
| Immigrants | Uzbekistan | 8.4 /100 | #209 | Tragic 45.4% |
| Cubans | 7.7 /100 | #210 | Tragic 45.4% |
| Immigrants | Spain | 7.3 /100 | #211 | Tragic 45.3% |
| Creek | 6.4 /100 | #212 | Tragic 45.3% |
| Yakama | 5.8 /100 | #213 | Tragic 45.2% |