Ecuadorian vs Immigrants from Bolivia Births to Unmarried Women
COMPARE
Ecuadorian
Immigrants from Bolivia
Births to Unmarried Women
Births to Unmarried Women Comparison
Ecuadorians
Immigrants from Bolivia
33.3%
BIRTHS TO UNMARRIED WOMEN
10.5/ 100
METRIC RATING
211th/ 347
METRIC RANK
28.6%
BIRTHS TO UNMARRIED WOMEN
98.5/ 100
METRIC RATING
74th/ 347
METRIC RANK
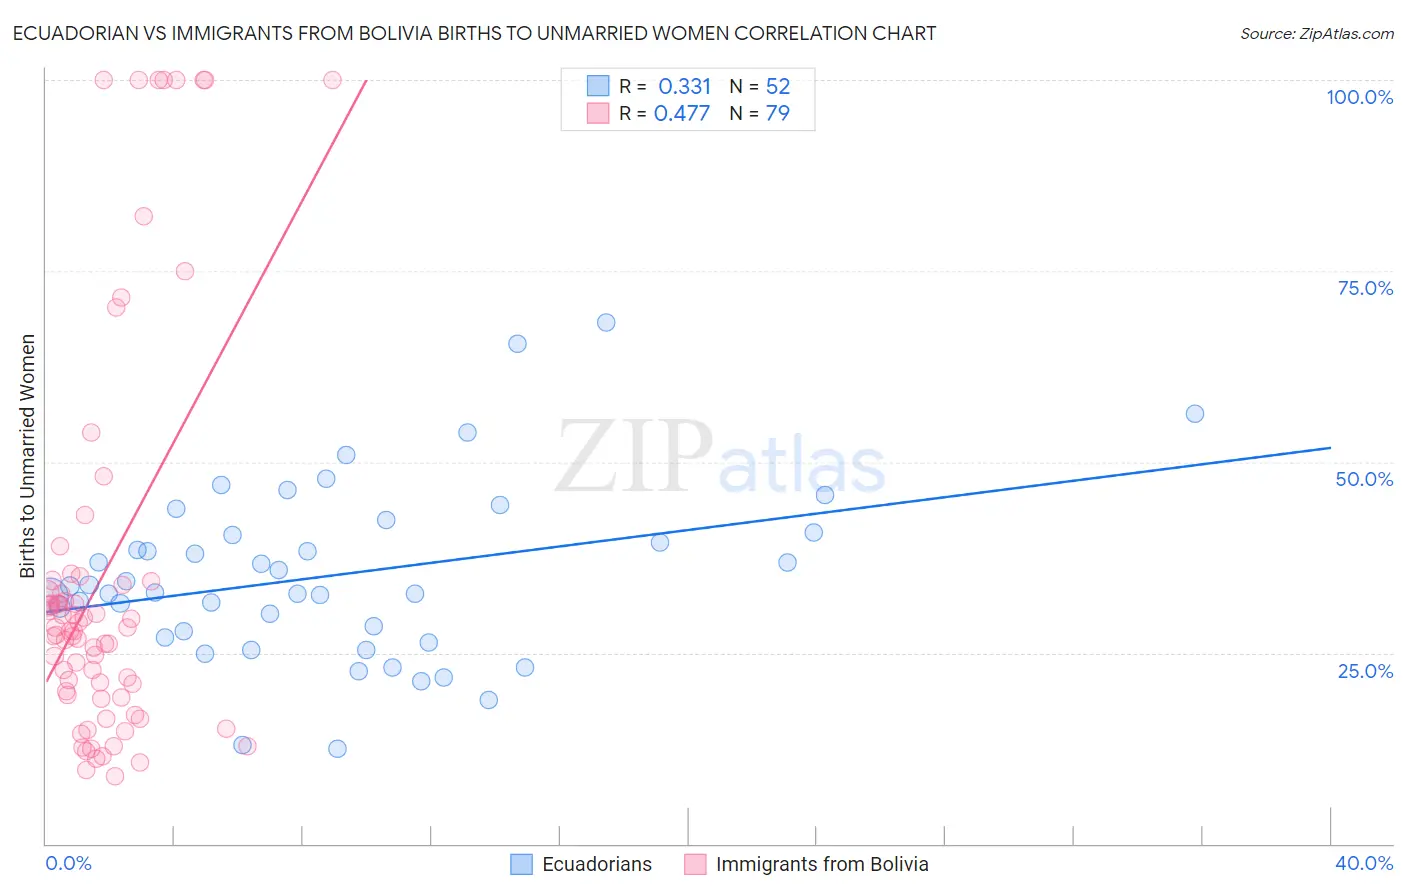
Ecuadorian vs Immigrants from Bolivia Births to Unmarried Women Correlation Chart
The statistical analysis conducted on geographies consisting of 300,726,329 people shows a mild positive correlation between the proportion of Ecuadorians and percentage of births to unmarried women in the United States with a correlation coefficient (R) of 0.331 and weighted average of 33.3%. Similarly, the statistical analysis conducted on geographies consisting of 153,801,306 people shows a moderate positive correlation between the proportion of Immigrants from Bolivia and percentage of births to unmarried women in the United States with a correlation coefficient (R) of 0.477 and weighted average of 28.6%, a difference of 16.5%.
Births to Unmarried Women Correlation Summary
| Measurement | Ecuadorian | Immigrants from Bolivia |
| Minimum | 12.5% | 8.9% |
| Maximum | 68.3% | 100.0% |
| Range | 55.8% | 91.1% |
| Mean | 35.1% | 35.2% |
| Median | 33.3% | 27.9% |
| Interquartile 25% (IQ1) | 27.4% | 19.4% |
| Interquartile 75% (IQ3) | 40.6% | 34.4% |
| Interquartile Range (IQR) | 13.2% | 15.0% |
| Standard Deviation (Sample) | 11.5% | 25.9% |
| Standard Deviation (Population) | 11.3% | 25.8% |
Similar Demographics by Births to Unmarried Women
Demographics Similar to Ecuadorians by Births to Unmarried Women
In terms of births to unmarried women, the demographic groups most similar to Ecuadorians are White/Caucasian (33.3%, a difference of 0.050%), Scotch-Irish (33.3%, a difference of 0.050%), Celtic (33.3%, a difference of 0.070%), Hawaiian (33.2%, a difference of 0.19%), and Immigrants from Sudan (33.2%, a difference of 0.22%).
| Demographics | Rating | Rank | Births to Unmarried Women |
| Immigrants | Africa | 14.3 /100 | #204 | Poor 33.0% |
| German Russians | 13.1 /100 | #205 | Poor 33.1% |
| Uruguayans | 12.8 /100 | #206 | Poor 33.1% |
| Immigrants | Sudan | 11.5 /100 | #207 | Poor 33.2% |
| Hawaiians | 11.3 /100 | #208 | Poor 33.2% |
| Whites/Caucasians | 10.7 /100 | #209 | Poor 33.3% |
| Scotch-Irish | 10.7 /100 | #210 | Poor 33.3% |
| Ecuadorians | 10.5 /100 | #211 | Poor 33.3% |
| Celtics | 10.2 /100 | #212 | Poor 33.3% |
| Immigrants | Costa Rica | 9.5 /100 | #213 | Tragic 33.4% |
| Slovaks | 9.3 /100 | #214 | Tragic 33.4% |
| French | 8.7 /100 | #215 | Tragic 33.4% |
| Nepalese | 7.8 /100 | #216 | Tragic 33.5% |
| Spaniards | 7.0 /100 | #217 | Tragic 33.6% |
| Immigrants | Ecuador | 5.9 /100 | #218 | Tragic 33.7% |
Demographics Similar to Immigrants from Bolivia by Births to Unmarried Women
In terms of births to unmarried women, the demographic groups most similar to Immigrants from Bolivia are Albanian (28.5%, a difference of 0.020%), Immigrants from Sweden (28.5%, a difference of 0.070%), Immigrants from Switzerland (28.6%, a difference of 0.090%), Israeli (28.6%, a difference of 0.10%), and Jordanian (28.5%, a difference of 0.13%).
| Demographics | Rating | Rank | Births to Unmarried Women |
| Palestinians | 98.7 /100 | #67 | Exceptional 28.4% |
| Immigrants | Europe | 98.7 /100 | #68 | Exceptional 28.4% |
| Bolivians | 98.7 /100 | #69 | Exceptional 28.5% |
| Laotians | 98.6 /100 | #70 | Exceptional 28.5% |
| Jordanians | 98.5 /100 | #71 | Exceptional 28.5% |
| Immigrants | Sweden | 98.5 /100 | #72 | Exceptional 28.5% |
| Albanians | 98.5 /100 | #73 | Exceptional 28.5% |
| Immigrants | Bolivia | 98.5 /100 | #74 | Exceptional 28.6% |
| Immigrants | Switzerland | 98.4 /100 | #75 | Exceptional 28.6% |
| Israelis | 98.4 /100 | #76 | Exceptional 28.6% |
| Immigrants | Northern Europe | 98.3 /100 | #77 | Exceptional 28.6% |
| Zimbabweans | 98.2 /100 | #78 | Exceptional 28.7% |
| Danes | 98.2 /100 | #79 | Exceptional 28.7% |
| Immigrants | Afghanistan | 98.1 /100 | #80 | Exceptional 28.7% |
| Immigrants | Austria | 98.1 /100 | #81 | Exceptional 28.7% |