Ecuadorian vs Immigrants from Peru Births to Unmarried Women
COMPARE
Ecuadorian
Immigrants from Peru
Births to Unmarried Women
Births to Unmarried Women Comparison
Ecuadorians
Immigrants from Peru
33.3%
BIRTHS TO UNMARRIED WOMEN
10.5/ 100
METRIC RATING
211th/ 347
METRIC RANK
31.8%
BIRTHS TO UNMARRIED WOMEN
45.1/ 100
METRIC RATING
181st/ 347
METRIC RANK
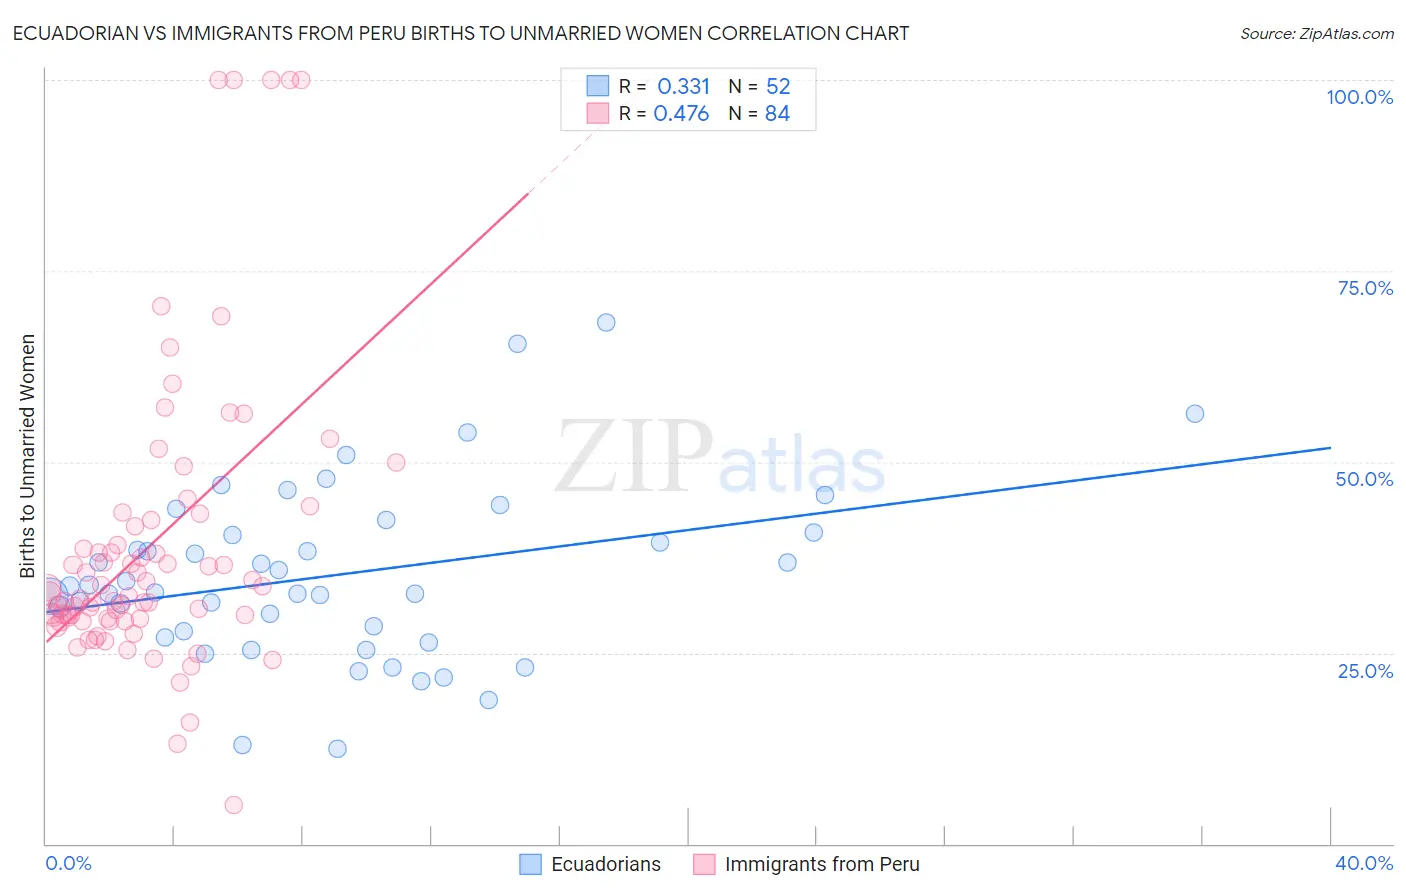
Ecuadorian vs Immigrants from Peru Births to Unmarried Women Correlation Chart
The statistical analysis conducted on geographies consisting of 300,726,329 people shows a mild positive correlation between the proportion of Ecuadorians and percentage of births to unmarried women in the United States with a correlation coefficient (R) of 0.331 and weighted average of 33.3%. Similarly, the statistical analysis conducted on geographies consisting of 311,348,081 people shows a moderate positive correlation between the proportion of Immigrants from Peru and percentage of births to unmarried women in the United States with a correlation coefficient (R) of 0.476 and weighted average of 31.8%, a difference of 4.6%.
Births to Unmarried Women Correlation Summary
| Measurement | Ecuadorian | Immigrants from Peru |
| Minimum | 12.5% | 5.1% |
| Maximum | 68.3% | 100.0% |
| Range | 55.8% | 94.9% |
| Mean | 35.1% | 39.0% |
| Median | 33.3% | 32.5% |
| Interquartile 25% (IQ1) | 27.4% | 29.5% |
| Interquartile 75% (IQ3) | 40.6% | 41.9% |
| Interquartile Range (IQR) | 13.2% | 12.4% |
| Standard Deviation (Sample) | 11.5% | 19.1% |
| Standard Deviation (Population) | 11.3% | 18.9% |
Similar Demographics by Births to Unmarried Women
Demographics Similar to Ecuadorians by Births to Unmarried Women
In terms of births to unmarried women, the demographic groups most similar to Ecuadorians are White/Caucasian (33.3%, a difference of 0.050%), Scotch-Irish (33.3%, a difference of 0.050%), Celtic (33.3%, a difference of 0.070%), Hawaiian (33.2%, a difference of 0.19%), and Immigrants from Sudan (33.2%, a difference of 0.22%).
| Demographics | Rating | Rank | Births to Unmarried Women |
| Immigrants | Africa | 14.3 /100 | #204 | Poor 33.0% |
| German Russians | 13.1 /100 | #205 | Poor 33.1% |
| Uruguayans | 12.8 /100 | #206 | Poor 33.1% |
| Immigrants | Sudan | 11.5 /100 | #207 | Poor 33.2% |
| Hawaiians | 11.3 /100 | #208 | Poor 33.2% |
| Whites/Caucasians | 10.7 /100 | #209 | Poor 33.3% |
| Scotch-Irish | 10.7 /100 | #210 | Poor 33.3% |
| Ecuadorians | 10.5 /100 | #211 | Poor 33.3% |
| Celtics | 10.2 /100 | #212 | Poor 33.3% |
| Immigrants | Costa Rica | 9.5 /100 | #213 | Tragic 33.4% |
| Slovaks | 9.3 /100 | #214 | Tragic 33.4% |
| French | 8.7 /100 | #215 | Tragic 33.4% |
| Nepalese | 7.8 /100 | #216 | Tragic 33.5% |
| Spaniards | 7.0 /100 | #217 | Tragic 33.6% |
| Immigrants | Ecuador | 5.9 /100 | #218 | Tragic 33.7% |
Demographics Similar to Immigrants from Peru by Births to Unmarried Women
In terms of births to unmarried women, the demographic groups most similar to Immigrants from Peru are Moroccan (31.8%, a difference of 0.060%), South American (31.8%, a difference of 0.18%), Kenyan (31.9%, a difference of 0.20%), English (31.7%, a difference of 0.22%), and South American Indian (31.7%, a difference of 0.25%).
| Demographics | Rating | Rank | Births to Unmarried Women |
| Venezuelans | 50.0 /100 | #174 | Average 31.7% |
| Immigrants | Venezuela | 49.2 /100 | #175 | Average 31.7% |
| Scottish | 48.1 /100 | #176 | Average 31.7% |
| South American Indians | 47.7 /100 | #177 | Average 31.7% |
| English | 47.4 /100 | #178 | Average 31.7% |
| South Americans | 46.9 /100 | #179 | Average 31.8% |
| Moroccans | 45.7 /100 | #180 | Average 31.8% |
| Immigrants | Peru | 45.1 /100 | #181 | Average 31.8% |
| Kenyans | 43.0 /100 | #182 | Average 31.9% |
| Canadians | 41.4 /100 | #183 | Average 31.9% |
| Immigrants | South America | 40.7 /100 | #184 | Average 32.0% |
| Germans | 39.5 /100 | #185 | Fair 32.0% |
| Welsh | 38.2 /100 | #186 | Fair 32.0% |
| Czechoslovakians | 38.0 /100 | #187 | Fair 32.0% |
| Osage | 37.1 /100 | #188 | Fair 32.1% |