Ecuadorian vs Immigrants from Bolivia 1st Grade
COMPARE
Ecuadorian
Immigrants from Bolivia
1st Grade
1st Grade Comparison
Ecuadorians
Immigrants from Bolivia
97.0%
1ST GRADE
0.0/ 100
METRIC RATING
305th/ 347
METRIC RANK
97.4%
1ST GRADE
0.2/ 100
METRIC RATING
273rd/ 347
METRIC RANK
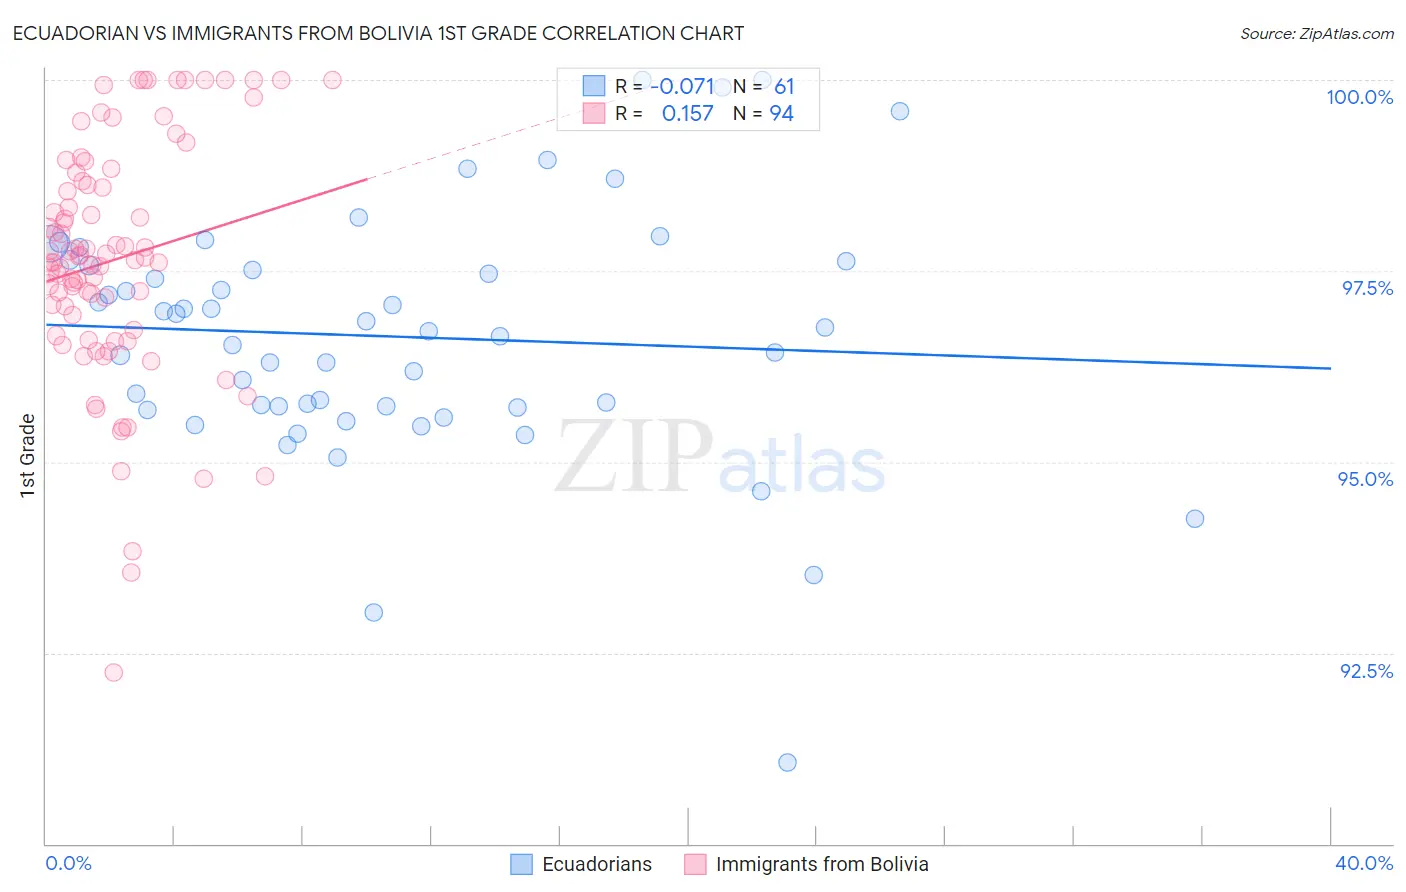
Ecuadorian vs Immigrants from Bolivia 1st Grade Correlation Chart
The statistical analysis conducted on geographies consisting of 317,865,723 people shows a slight negative correlation between the proportion of Ecuadorians and percentage of population with at least 1st grade education in the United States with a correlation coefficient (R) of -0.071 and weighted average of 97.0%. Similarly, the statistical analysis conducted on geographies consisting of 158,728,833 people shows a poor positive correlation between the proportion of Immigrants from Bolivia and percentage of population with at least 1st grade education in the United States with a correlation coefficient (R) of 0.157 and weighted average of 97.4%, a difference of 0.46%.
1st Grade Correlation Summary
| Measurement | Ecuadorian | Immigrants from Bolivia |
| Minimum | 91.1% | 92.2% |
| Maximum | 100.0% | 100.0% |
| Range | 8.9% | 7.8% |
| Mean | 96.6% | 97.6% |
| Median | 96.7% | 97.7% |
| Interquartile 25% (IQ1) | 95.7% | 96.7% |
| Interquartile 75% (IQ3) | 97.6% | 98.7% |
| Interquartile Range (IQR) | 1.9% | 1.9% |
| Standard Deviation (Sample) | 1.6% | 1.6% |
| Standard Deviation (Population) | 1.6% | 1.6% |
Similar Demographics by 1st Grade
Demographics Similar to Ecuadorians by 1st Grade
In terms of 1st grade, the demographic groups most similar to Ecuadorians are Nicaraguan (97.0%, a difference of 0.0%), Somali (97.0%, a difference of 0.020%), Immigrants from Caribbean (97.0%, a difference of 0.050%), Belizean (96.9%, a difference of 0.060%), and Immigrants from Somalia (96.9%, a difference of 0.060%).
| Demographics | Rating | Rank | 1st Grade |
| Immigrants | Dominica | 0.0 /100 | #298 | Tragic 97.1% |
| Immigrants | Cuba | 0.0 /100 | #299 | Tragic 97.1% |
| Haitians | 0.0 /100 | #300 | Tragic 97.1% |
| Immigrants | South Eastern Asia | 0.0 /100 | #301 | Tragic 97.1% |
| Immigrants | Caribbean | 0.0 /100 | #302 | Tragic 97.0% |
| Somalis | 0.0 /100 | #303 | Tragic 97.0% |
| Nicaraguans | 0.0 /100 | #304 | Tragic 97.0% |
| Ecuadorians | 0.0 /100 | #305 | Tragic 97.0% |
| Belizeans | 0.0 /100 | #306 | Tragic 96.9% |
| Immigrants | Somalia | 0.0 /100 | #307 | Tragic 96.9% |
| Hispanics or Latinos | 0.0 /100 | #308 | Tragic 96.9% |
| Immigrants | Haiti | 0.0 /100 | #309 | Tragic 96.9% |
| Immigrants | Azores | 0.0 /100 | #310 | Tragic 96.9% |
| Sri Lankans | 0.0 /100 | #311 | Tragic 96.9% |
| Cape Verdeans | 0.0 /100 | #312 | Tragic 96.9% |
Demographics Similar to Immigrants from Bolivia by 1st Grade
In terms of 1st grade, the demographic groups most similar to Immigrants from Bolivia are Immigrants from Cameroon (97.4%, a difference of 0.0%), Immigrants from Peru (97.4%, a difference of 0.0%), Immigrants from Jamaica (97.5%, a difference of 0.020%), Ghanaian (97.4%, a difference of 0.030%), and Immigrants from China (97.4%, a difference of 0.030%).
| Demographics | Rating | Rank | 1st Grade |
| Immigrants | Liberia | 0.3 /100 | #266 | Tragic 97.5% |
| Immigrants | Sierra Leone | 0.3 /100 | #267 | Tragic 97.5% |
| Immigrants | Nigeria | 0.3 /100 | #268 | Tragic 97.5% |
| West Indians | 0.3 /100 | #269 | Tragic 97.5% |
| Immigrants | Jamaica | 0.2 /100 | #270 | Tragic 97.5% |
| Immigrants | Cameroon | 0.2 /100 | #271 | Tragic 97.4% |
| Immigrants | Peru | 0.2 /100 | #272 | Tragic 97.4% |
| Immigrants | Bolivia | 0.2 /100 | #273 | Tragic 97.4% |
| Ghanaians | 0.1 /100 | #274 | Tragic 97.4% |
| Immigrants | China | 0.1 /100 | #275 | Tragic 97.4% |
| Immigrants | Philippines | 0.1 /100 | #276 | Tragic 97.4% |
| Immigrants | Western Africa | 0.1 /100 | #277 | Tragic 97.4% |
| Immigrants | Uzbekistan | 0.1 /100 | #278 | Tragic 97.4% |
| Immigrants | Ghana | 0.1 /100 | #279 | Tragic 97.4% |
| Afghans | 0.1 /100 | #280 | Tragic 97.4% |