Dutch vs Immigrants from Cuba Divorced or Separated
COMPARE
Dutch
Immigrants from Cuba
Divorced or Separated
Divorced or Separated Comparison
Dutch
Immigrants from Cuba
12.4%
DIVORCED OR SEPARATED
3.1/ 100
METRIC RATING
242nd/ 347
METRIC RANK
15.2%
DIVORCED OR SEPARATED
0.0/ 100
METRIC RATING
347th/ 347
METRIC RANK
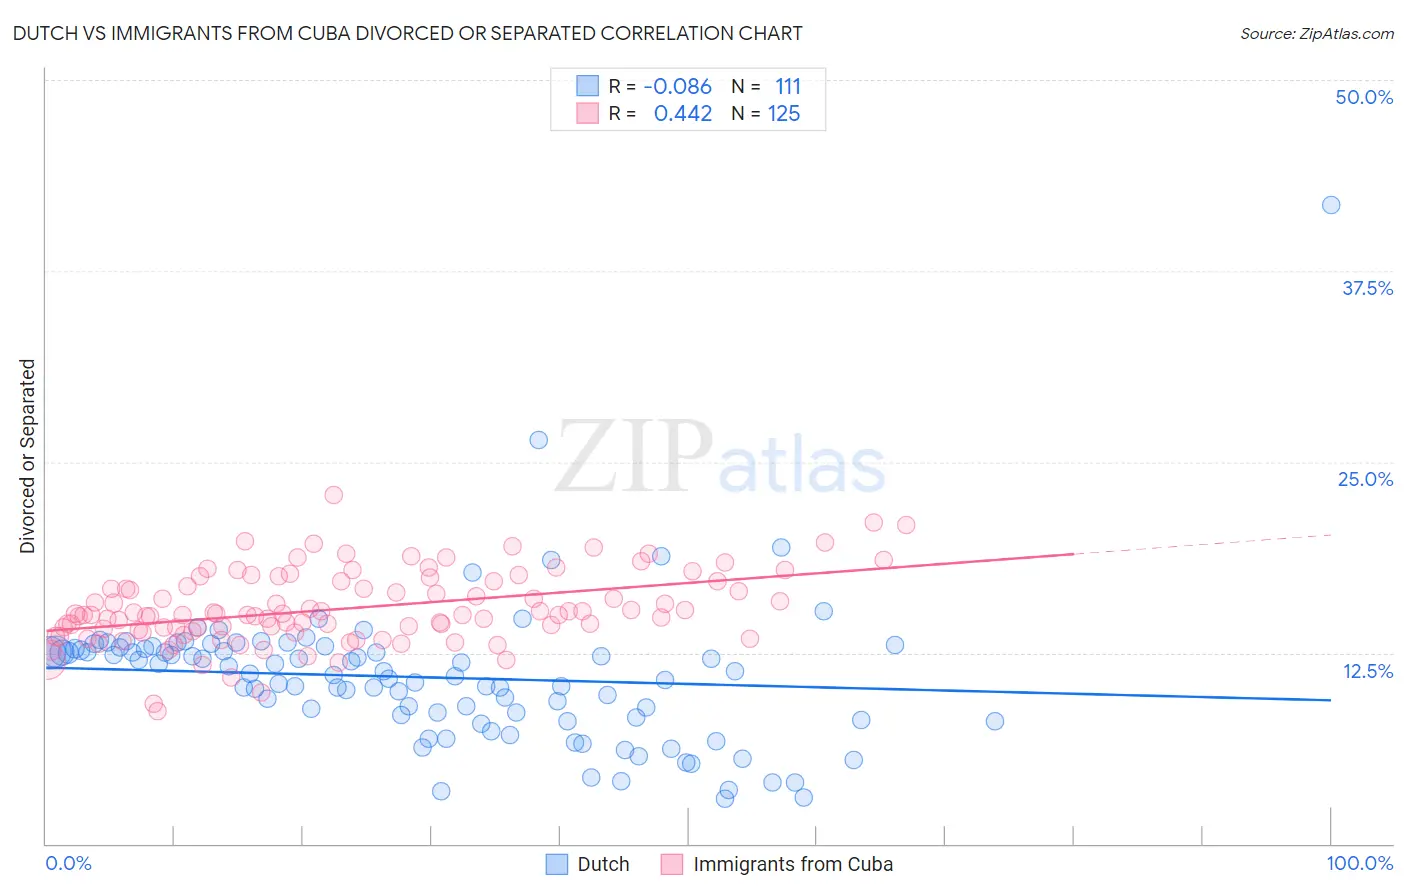
Dutch vs Immigrants from Cuba Divorced or Separated Correlation Chart
The statistical analysis conducted on geographies consisting of 553,980,787 people shows a slight negative correlation between the proportion of Dutch and percentage of population currently divorced or separated in the United States with a correlation coefficient (R) of -0.086 and weighted average of 12.4%. Similarly, the statistical analysis conducted on geographies consisting of 325,985,435 people shows a moderate positive correlation between the proportion of Immigrants from Cuba and percentage of population currently divorced or separated in the United States with a correlation coefficient (R) of 0.442 and weighted average of 15.2%, a difference of 22.7%.
Divorced or Separated Correlation Summary
| Measurement | Dutch | Immigrants from Cuba |
| Minimum | 3.0% | 8.7% |
| Maximum | 41.8% | 22.8% |
| Range | 38.9% | 14.1% |
| Mean | 10.9% | 15.4% |
| Median | 11.1% | 15.0% |
| Interquartile 25% (IQ1) | 8.3% | 14.0% |
| Interquartile 75% (IQ3) | 12.8% | 17.2% |
| Interquartile Range (IQR) | 4.5% | 3.2% |
| Standard Deviation (Sample) | 4.7% | 2.4% |
| Standard Deviation (Population) | 4.7% | 2.4% |
Similar Demographics by Divorced or Separated
Demographics Similar to Dutch by Divorced or Separated
In terms of divorced or separated, the demographic groups most similar to Dutch are Immigrants from Latin America (12.4%, a difference of 0.070%), Uruguayan (12.4%, a difference of 0.090%), British West Indian (12.4%, a difference of 0.17%), Alaska Native (12.4%, a difference of 0.17%), and Immigrants from Germany (12.4%, a difference of 0.23%).
| Demographics | Rating | Rank | Divorced or Separated |
| Immigrants | Bosnia and Herzegovina | 4.3 /100 | #235 | Tragic 12.4% |
| Colombians | 4.2 /100 | #236 | Tragic 12.4% |
| Immigrants | Laos | 4.2 /100 | #237 | Tragic 12.4% |
| Sudanese | 4.0 /100 | #238 | Tragic 12.4% |
| Immigrants | Germany | 4.0 /100 | #239 | Tragic 12.4% |
| British West Indians | 3.7 /100 | #240 | Tragic 12.4% |
| Uruguayans | 3.4 /100 | #241 | Tragic 12.4% |
| Dutch | 3.1 /100 | #242 | Tragic 12.4% |
| Immigrants | Latin America | 2.8 /100 | #243 | Tragic 12.4% |
| Alaska Natives | 2.5 /100 | #244 | Tragic 12.4% |
| Hispanics or Latinos | 2.0 /100 | #245 | Tragic 12.5% |
| Immigrants | West Indies | 1.9 /100 | #246 | Tragic 12.5% |
| Germans | 1.8 /100 | #247 | Tragic 12.5% |
| Nepalese | 1.8 /100 | #248 | Tragic 12.5% |
| Finns | 1.8 /100 | #249 | Tragic 12.5% |
Demographics Similar to Immigrants from Cuba by Divorced or Separated
In terms of divorced or separated, the demographic groups most similar to Immigrants from Cuba are Arapaho (14.8%, a difference of 2.8%), Kiowa (14.5%, a difference of 4.9%), Cuban (14.5%, a difference of 5.0%), Creek (14.4%, a difference of 5.7%), and Seminole (14.3%, a difference of 6.8%).
| Demographics | Rating | Rank | Divorced or Separated |
| Puerto Ricans | 0.0 /100 | #333 | Tragic 13.9% |
| Immigrants | Bahamas | 0.0 /100 | #334 | Tragic 13.9% |
| Dutch West Indians | 0.0 /100 | #335 | Tragic 14.0% |
| Shoshone | 0.0 /100 | #336 | Tragic 14.0% |
| Crow | 0.0 /100 | #337 | Tragic 14.1% |
| Choctaw | 0.0 /100 | #338 | Tragic 14.1% |
| Colville | 0.0 /100 | #339 | Tragic 14.2% |
| Chickasaw | 0.0 /100 | #340 | Tragic 14.2% |
| Bahamians | 0.0 /100 | #341 | Tragic 14.2% |
| Seminole | 0.0 /100 | #342 | Tragic 14.3% |
| Creek | 0.0 /100 | #343 | Tragic 14.4% |
| Cubans | 0.0 /100 | #344 | Tragic 14.5% |
| Kiowa | 0.0 /100 | #345 | Tragic 14.5% |
| Arapaho | 0.0 /100 | #346 | Tragic 14.8% |
| Immigrants | Cuba | 0.0 /100 | #347 | Tragic 15.2% |