Bolivian vs Immigrants from Cuba Divorced or Separated
COMPARE
Bolivian
Immigrants from Cuba
Divorced or Separated
Divorced or Separated Comparison
Bolivians
Immigrants from Cuba
11.2%
DIVORCED OR SEPARATED
100.0/ 100
METRIC RATING
50th/ 347
METRIC RANK
15.2%
DIVORCED OR SEPARATED
0.0/ 100
METRIC RATING
347th/ 347
METRIC RANK
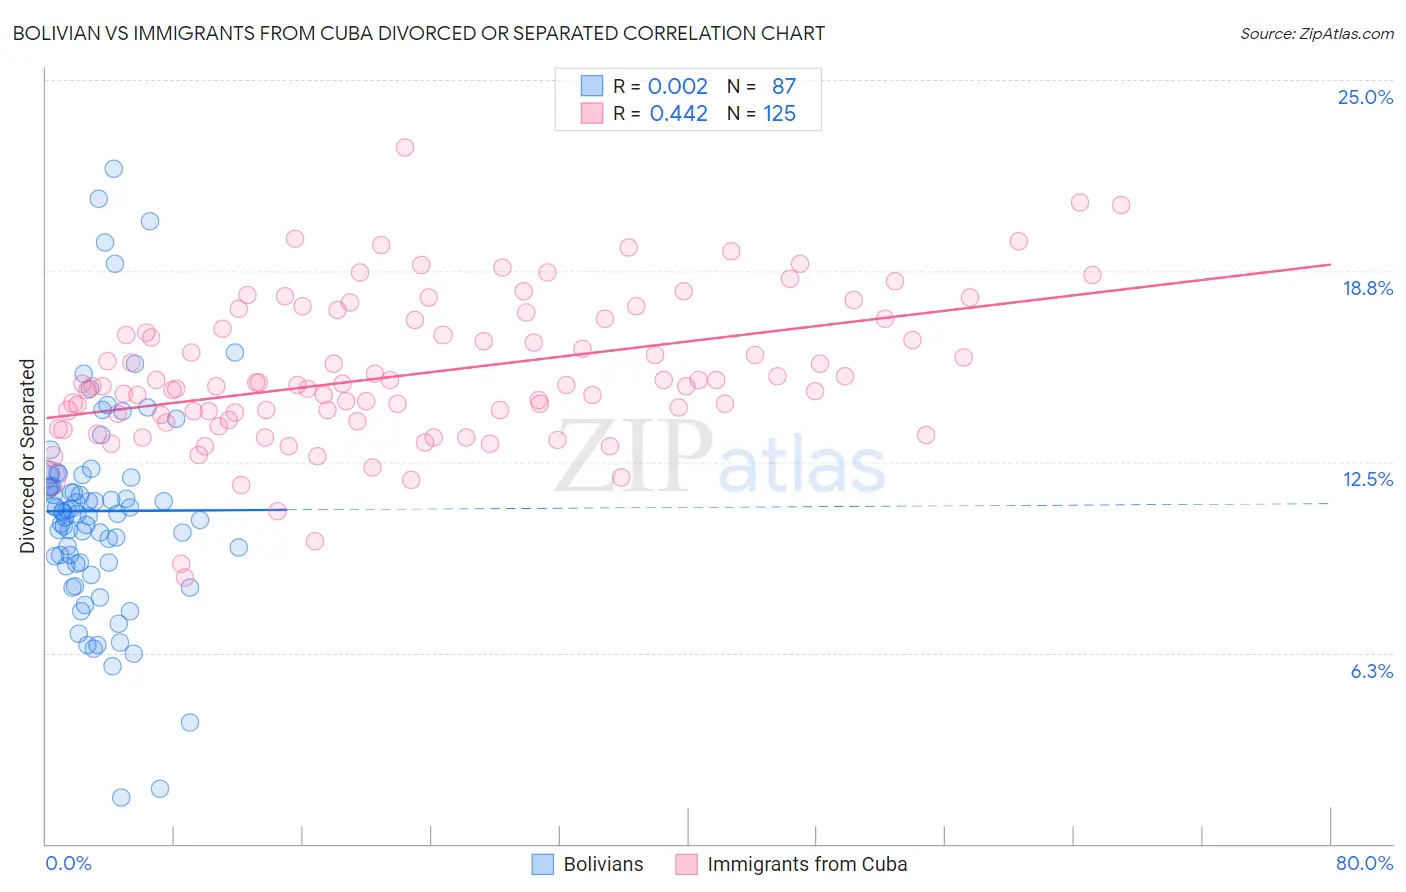
Bolivian vs Immigrants from Cuba Divorced or Separated Correlation Chart
The statistical analysis conducted on geographies consisting of 184,650,431 people shows no correlation between the proportion of Bolivians and percentage of population currently divorced or separated in the United States with a correlation coefficient (R) of 0.002 and weighted average of 11.2%. Similarly, the statistical analysis conducted on geographies consisting of 325,985,435 people shows a moderate positive correlation between the proportion of Immigrants from Cuba and percentage of population currently divorced or separated in the United States with a correlation coefficient (R) of 0.442 and weighted average of 15.2%, a difference of 35.8%.
Divorced or Separated Correlation Summary
| Measurement | Bolivian | Immigrants from Cuba |
| Minimum | 1.5% | 8.7% |
| Maximum | 22.1% | 22.8% |
| Range | 20.6% | 14.1% |
| Mean | 10.9% | 15.4% |
| Median | 10.8% | 15.0% |
| Interquartile 25% (IQ1) | 9.2% | 14.0% |
| Interquartile 75% (IQ3) | 12.1% | 17.2% |
| Interquartile Range (IQR) | 2.9% | 3.2% |
| Standard Deviation (Sample) | 3.6% | 2.4% |
| Standard Deviation (Population) | 3.5% | 2.4% |
Similar Demographics by Divorced or Separated
Demographics Similar to Bolivians by Divorced or Separated
In terms of divorced or separated, the demographic groups most similar to Bolivians are Immigrants from Saudi Arabia (11.2%, a difference of 0.070%), Immigrants from Turkey (11.2%, a difference of 0.080%), Immigrants from Poland (11.2%, a difference of 0.10%), Laotian (11.2%, a difference of 0.12%), and Turkish (11.2%, a difference of 0.23%).
| Demographics | Rating | Rank | Divorced or Separated |
| Immigrants | Belarus | 100.0 /100 | #43 | Exceptional 11.2% |
| Immigrants | Western Asia | 100.0 /100 | #44 | Exceptional 11.2% |
| Turks | 100.0 /100 | #45 | Exceptional 11.2% |
| Laotians | 100.0 /100 | #46 | Exceptional 11.2% |
| Immigrants | Poland | 100.0 /100 | #47 | Exceptional 11.2% |
| Immigrants | Turkey | 100.0 /100 | #48 | Exceptional 11.2% |
| Immigrants | Saudi Arabia | 100.0 /100 | #49 | Exceptional 11.2% |
| Bolivians | 100.0 /100 | #50 | Exceptional 11.2% |
| Immigrants | Bolivia | 100.0 /100 | #51 | Exceptional 11.3% |
| Immigrants | Australia | 99.9 /100 | #52 | Exceptional 11.3% |
| Immigrants | Lithuania | 99.9 /100 | #53 | Exceptional 11.3% |
| Eastern Europeans | 99.9 /100 | #54 | Exceptional 11.3% |
| Immigrants | Yemen | 99.9 /100 | #55 | Exceptional 11.3% |
| Immigrants | Philippines | 99.9 /100 | #56 | Exceptional 11.3% |
| Immigrants | Vietnam | 99.9 /100 | #57 | Exceptional 11.3% |
Demographics Similar to Immigrants from Cuba by Divorced or Separated
In terms of divorced or separated, the demographic groups most similar to Immigrants from Cuba are Arapaho (14.8%, a difference of 2.8%), Kiowa (14.5%, a difference of 4.9%), Cuban (14.5%, a difference of 5.0%), Creek (14.4%, a difference of 5.7%), and Seminole (14.3%, a difference of 6.8%).
| Demographics | Rating | Rank | Divorced or Separated |
| Puerto Ricans | 0.0 /100 | #333 | Tragic 13.9% |
| Immigrants | Bahamas | 0.0 /100 | #334 | Tragic 13.9% |
| Dutch West Indians | 0.0 /100 | #335 | Tragic 14.0% |
| Shoshone | 0.0 /100 | #336 | Tragic 14.0% |
| Crow | 0.0 /100 | #337 | Tragic 14.1% |
| Choctaw | 0.0 /100 | #338 | Tragic 14.1% |
| Colville | 0.0 /100 | #339 | Tragic 14.2% |
| Chickasaw | 0.0 /100 | #340 | Tragic 14.2% |
| Bahamians | 0.0 /100 | #341 | Tragic 14.2% |
| Seminole | 0.0 /100 | #342 | Tragic 14.3% |
| Creek | 0.0 /100 | #343 | Tragic 14.4% |
| Cubans | 0.0 /100 | #344 | Tragic 14.5% |
| Kiowa | 0.0 /100 | #345 | Tragic 14.5% |
| Arapaho | 0.0 /100 | #346 | Tragic 14.8% |
| Immigrants | Cuba | 0.0 /100 | #347 | Tragic 15.2% |