Cree vs Immigrants from Yemen Family Households
COMPARE
Cree
Immigrants from Yemen
Family Households
Family Households Comparison
Cree
Immigrants from Yemen
62.3%
FAMILY HOUSEHOLDS
0.0/ 100
METRIC RATING
303rd/ 347
METRIC RANK
63.0%
FAMILY HOUSEHOLDS
0.2/ 100
METRIC RATING
279th/ 347
METRIC RANK
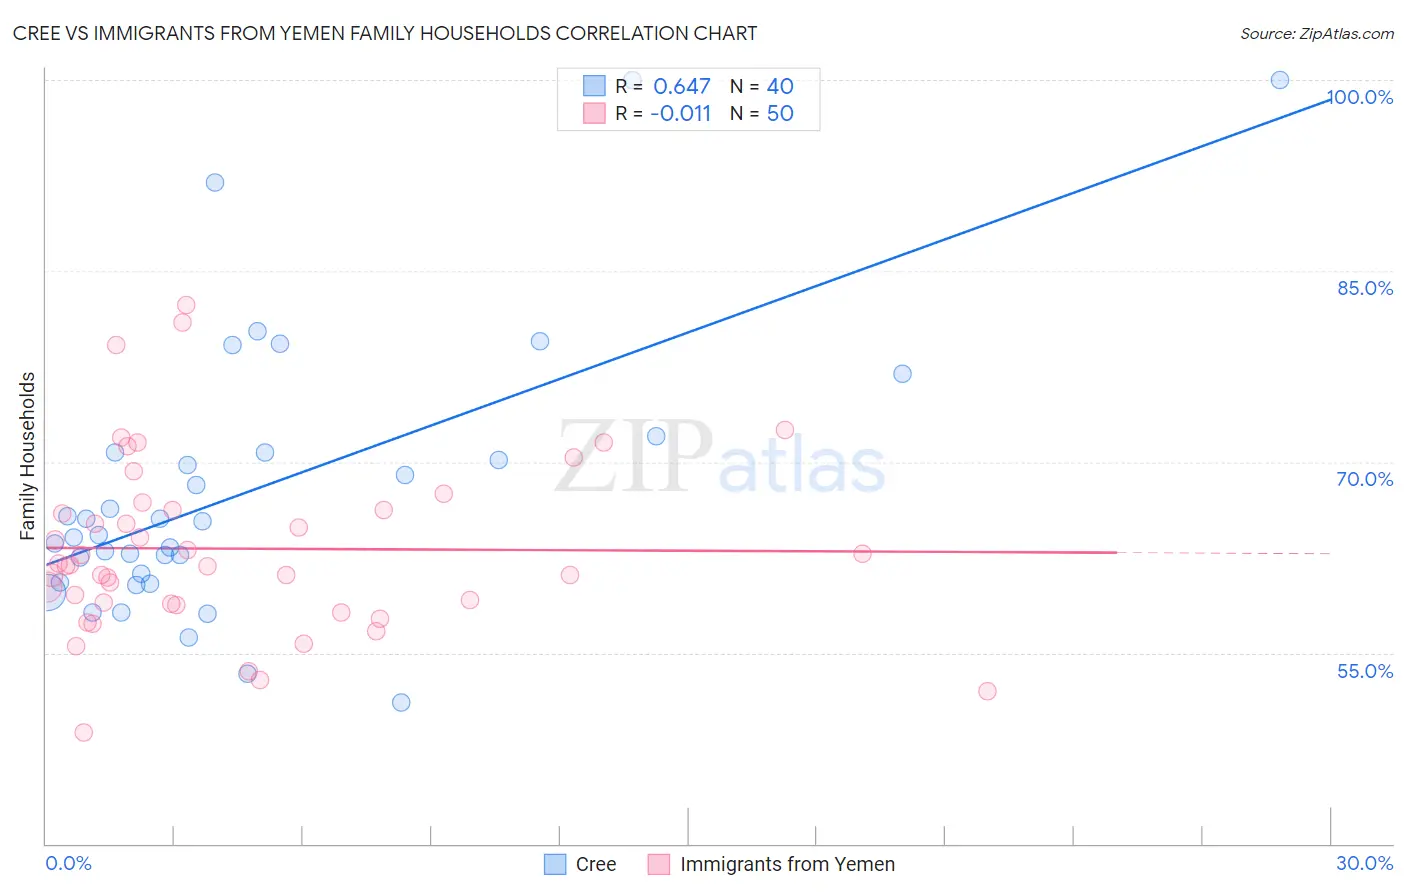
Cree vs Immigrants from Yemen Family Households Correlation Chart
The statistical analysis conducted on geographies consisting of 76,210,457 people shows a significant positive correlation between the proportion of Cree and percentage of family households in the United States with a correlation coefficient (R) of 0.647 and weighted average of 62.3%. Similarly, the statistical analysis conducted on geographies consisting of 82,431,124 people shows no correlation between the proportion of Immigrants from Yemen and percentage of family households in the United States with a correlation coefficient (R) of -0.011 and weighted average of 63.0%, a difference of 1.1%.
Family Households Correlation Summary
| Measurement | Cree | Immigrants from Yemen |
| Minimum | 51.1% | 48.7% |
| Maximum | 100.0% | 82.3% |
| Range | 48.9% | 33.6% |
| Mean | 67.8% | 63.2% |
| Median | 64.8% | 61.9% |
| Interquartile 25% (IQ1) | 60.9% | 58.8% |
| Interquartile 75% (IQ3) | 70.7% | 66.2% |
| Interquartile Range (IQR) | 9.9% | 7.4% |
| Standard Deviation (Sample) | 11.0% | 7.0% |
| Standard Deviation (Population) | 10.9% | 6.9% |
Similar Demographics by Family Households
Demographics Similar to Cree by Family Households
In terms of family households, the demographic groups most similar to Cree are Immigrants from Kenya (62.3%, a difference of 0.060%), Immigrants from Albania (62.4%, a difference of 0.10%), Iroquois (62.2%, a difference of 0.10%), Immigrants from Kuwait (62.4%, a difference of 0.12%), and Immigrants from Africa (62.4%, a difference of 0.12%).
| Demographics | Rating | Rank | Family Households |
| Slovenes | 0.0 /100 | #296 | Tragic 62.4% |
| French American Indians | 0.0 /100 | #297 | Tragic 62.4% |
| Immigrants | Spain | 0.0 /100 | #298 | Tragic 62.4% |
| Immigrants | Kuwait | 0.0 /100 | #299 | Tragic 62.4% |
| Immigrants | Africa | 0.0 /100 | #300 | Tragic 62.4% |
| Immigrants | Albania | 0.0 /100 | #301 | Tragic 62.4% |
| Immigrants | Kenya | 0.0 /100 | #302 | Tragic 62.3% |
| Cree | 0.0 /100 | #303 | Tragic 62.3% |
| Iroquois | 0.0 /100 | #304 | Tragic 62.2% |
| Bermudans | 0.0 /100 | #305 | Tragic 62.2% |
| Africans | 0.0 /100 | #306 | Tragic 62.1% |
| Immigrants | Norway | 0.0 /100 | #307 | Tragic 62.1% |
| Chippewa | 0.0 /100 | #308 | Tragic 62.1% |
| Sub-Saharan Africans | 0.0 /100 | #309 | Tragic 62.1% |
| Immigrants | Liberia | 0.0 /100 | #310 | Tragic 62.0% |
Demographics Similar to Immigrants from Yemen by Family Households
In terms of family households, the demographic groups most similar to Immigrants from Yemen are Immigrants from Bulgaria (63.0%, a difference of 0.010%), Immigrants from Belgium (63.0%, a difference of 0.040%), Ottawa (63.0%, a difference of 0.080%), Estonian (62.9%, a difference of 0.11%), and Serbian (63.0%, a difference of 0.13%).
| Demographics | Rating | Rank | Family Households |
| Immigrants | Turkey | 0.3 /100 | #272 | Tragic 63.1% |
| Immigrants | Kazakhstan | 0.3 /100 | #273 | Tragic 63.1% |
| Lumbee | 0.3 /100 | #274 | Tragic 63.1% |
| West Indians | 0.3 /100 | #275 | Tragic 63.1% |
| Serbians | 0.3 /100 | #276 | Tragic 63.0% |
| Ottawa | 0.3 /100 | #277 | Tragic 63.0% |
| Immigrants | Belgium | 0.2 /100 | #278 | Tragic 63.0% |
| Immigrants | Yemen | 0.2 /100 | #279 | Tragic 63.0% |
| Immigrants | Bulgaria | 0.2 /100 | #280 | Tragic 63.0% |
| Estonians | 0.2 /100 | #281 | Tragic 62.9% |
| New Zealanders | 0.1 /100 | #282 | Tragic 62.9% |
| Immigrants | Denmark | 0.1 /100 | #283 | Tragic 62.9% |
| Australians | 0.1 /100 | #284 | Tragic 62.8% |
| Mongolians | 0.1 /100 | #285 | Tragic 62.8% |
| British West Indians | 0.1 /100 | #286 | Tragic 62.8% |