Cree vs Immigrants from Western Europe Family Households
COMPARE
Cree
Immigrants from Western Europe
Family Households
Family Households Comparison
Cree
Immigrants from Western Europe
62.3%
FAMILY HOUSEHOLDS
0.0/ 100
METRIC RATING
303rd/ 347
METRIC RANK
63.2%
FAMILY HOUSEHOLDS
0.6/ 100
METRIC RATING
259th/ 347
METRIC RANK
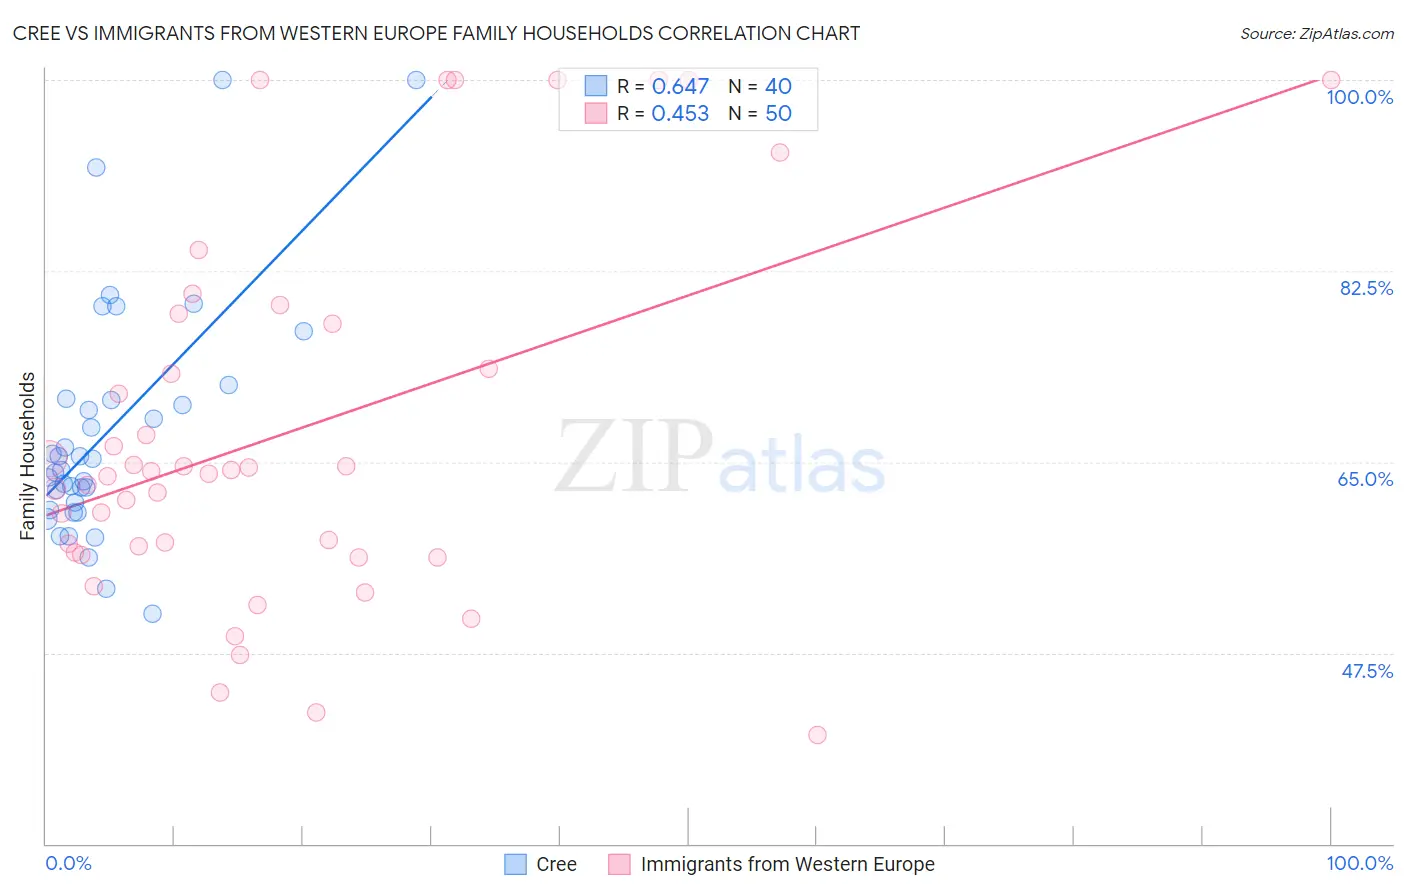
Cree vs Immigrants from Western Europe Family Households Correlation Chart
The statistical analysis conducted on geographies consisting of 76,210,457 people shows a significant positive correlation between the proportion of Cree and percentage of family households in the United States with a correlation coefficient (R) of 0.647 and weighted average of 62.3%. Similarly, the statistical analysis conducted on geographies consisting of 493,828,314 people shows a moderate positive correlation between the proportion of Immigrants from Western Europe and percentage of family households in the United States with a correlation coefficient (R) of 0.453 and weighted average of 63.2%, a difference of 1.5%.
Family Households Correlation Summary
| Measurement | Cree | Immigrants from Western Europe |
| Minimum | 51.1% | 40.0% |
| Maximum | 100.0% | 100.0% |
| Range | 48.9% | 60.0% |
| Mean | 67.8% | 67.6% |
| Median | 64.8% | 64.0% |
| Interquartile 25% (IQ1) | 60.9% | 56.7% |
| Interquartile 75% (IQ3) | 70.7% | 77.7% |
| Interquartile Range (IQR) | 9.9% | 21.0% |
| Standard Deviation (Sample) | 11.0% | 16.8% |
| Standard Deviation (Population) | 10.9% | 16.6% |
Similar Demographics by Family Households
Demographics Similar to Cree by Family Households
In terms of family households, the demographic groups most similar to Cree are Immigrants from Kenya (62.3%, a difference of 0.060%), Immigrants from Albania (62.4%, a difference of 0.10%), Iroquois (62.2%, a difference of 0.10%), Immigrants from Kuwait (62.4%, a difference of 0.12%), and Immigrants from Africa (62.4%, a difference of 0.12%).
| Demographics | Rating | Rank | Family Households |
| Slovenes | 0.0 /100 | #296 | Tragic 62.4% |
| French American Indians | 0.0 /100 | #297 | Tragic 62.4% |
| Immigrants | Spain | 0.0 /100 | #298 | Tragic 62.4% |
| Immigrants | Kuwait | 0.0 /100 | #299 | Tragic 62.4% |
| Immigrants | Africa | 0.0 /100 | #300 | Tragic 62.4% |
| Immigrants | Albania | 0.0 /100 | #301 | Tragic 62.4% |
| Immigrants | Kenya | 0.0 /100 | #302 | Tragic 62.3% |
| Cree | 0.0 /100 | #303 | Tragic 62.3% |
| Iroquois | 0.0 /100 | #304 | Tragic 62.2% |
| Bermudans | 0.0 /100 | #305 | Tragic 62.2% |
| Africans | 0.0 /100 | #306 | Tragic 62.1% |
| Immigrants | Norway | 0.0 /100 | #307 | Tragic 62.1% |
| Chippewa | 0.0 /100 | #308 | Tragic 62.1% |
| Sub-Saharan Africans | 0.0 /100 | #309 | Tragic 62.1% |
| Immigrants | Liberia | 0.0 /100 | #310 | Tragic 62.0% |
Demographics Similar to Immigrants from Western Europe by Family Households
In terms of family households, the demographic groups most similar to Immigrants from Western Europe are Immigrants from Barbados (63.2%, a difference of 0.010%), Cypriot (63.2%, a difference of 0.020%), Immigrants from Russia (63.2%, a difference of 0.040%), Immigrants from Ireland (63.2%, a difference of 0.050%), and Icelander (63.3%, a difference of 0.070%).
| Demographics | Rating | Rank | Family Households |
| Bahamians | 1.1 /100 | #252 | Tragic 63.3% |
| Immigrants | Dominican Republic | 1.0 /100 | #253 | Tragic 63.3% |
| Slovaks | 1.0 /100 | #254 | Tragic 63.3% |
| Potawatomi | 1.0 /100 | #255 | Tragic 63.3% |
| Luxembourgers | 0.9 /100 | #256 | Tragic 63.3% |
| Icelanders | 0.8 /100 | #257 | Tragic 63.3% |
| Immigrants | Barbados | 0.7 /100 | #258 | Tragic 63.2% |
| Immigrants | Western Europe | 0.6 /100 | #259 | Tragic 63.2% |
| Cypriots | 0.6 /100 | #260 | Tragic 63.2% |
| Immigrants | Russia | 0.6 /100 | #261 | Tragic 63.2% |
| Immigrants | Ireland | 0.6 /100 | #262 | Tragic 63.2% |
| Cheyenne | 0.5 /100 | #263 | Tragic 63.2% |
| Kenyans | 0.5 /100 | #264 | Tragic 63.2% |
| Colville | 0.5 /100 | #265 | Tragic 63.2% |
| Immigrants | Western Africa | 0.5 /100 | #266 | Tragic 63.1% |