Choctaw vs Cuban Family Households
COMPARE
Choctaw
Cuban
Family Households
Family Households Comparison
Choctaw
Cubans
64.9%
FAMILY HOUSEHOLDS
93.4/ 100
METRIC RATING
123rd/ 347
METRIC RANK
67.7%
FAMILY HOUSEHOLDS
100.0/ 100
METRIC RATING
21st/ 347
METRIC RANK
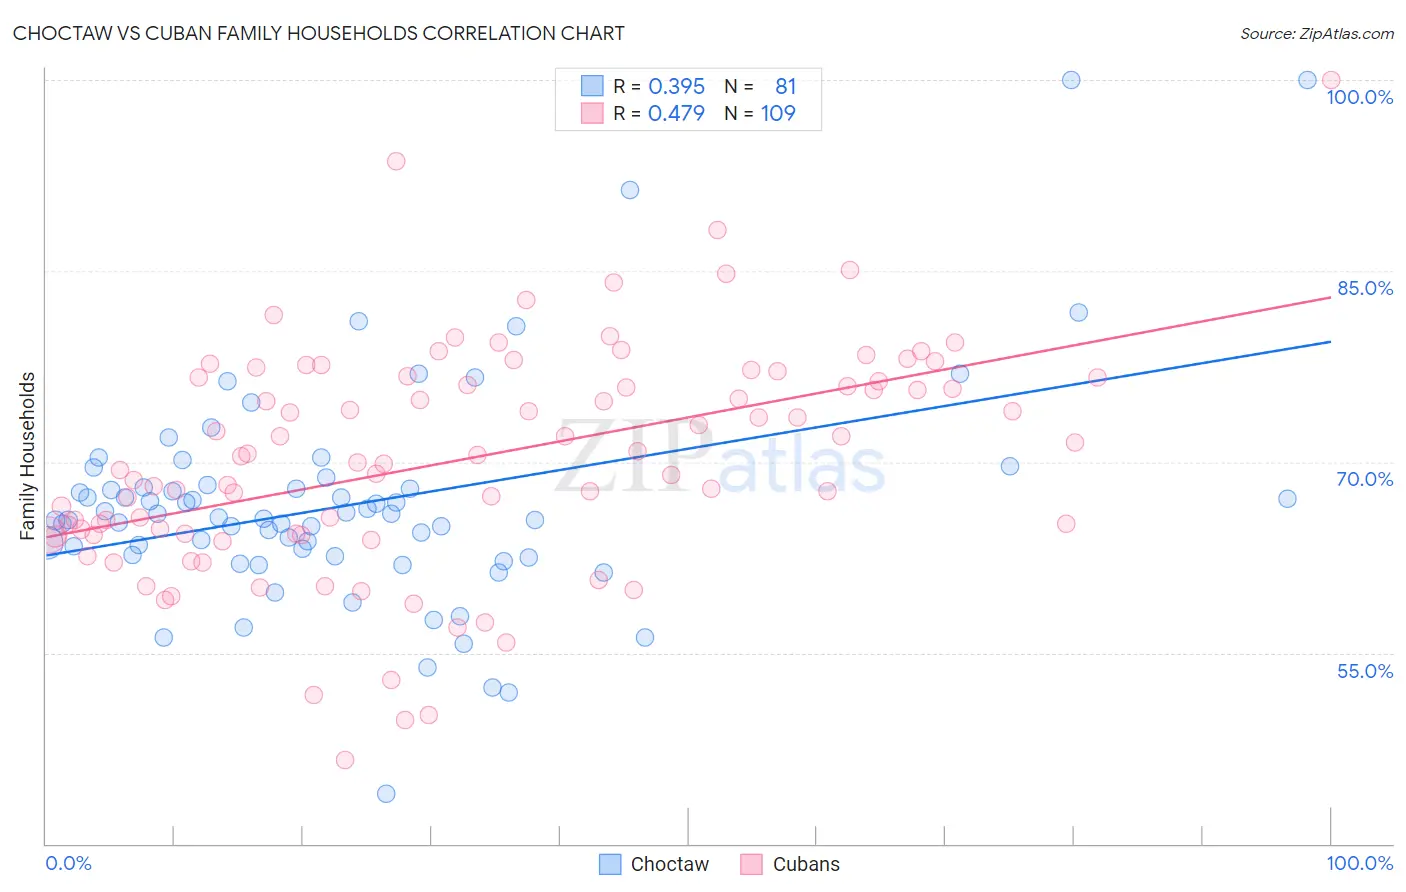
Choctaw vs Cuban Family Households Correlation Chart
The statistical analysis conducted on geographies consisting of 269,627,638 people shows a mild positive correlation between the proportion of Choctaw and percentage of family households in the United States with a correlation coefficient (R) of 0.395 and weighted average of 64.9%. Similarly, the statistical analysis conducted on geographies consisting of 448,974,040 people shows a moderate positive correlation between the proportion of Cubans and percentage of family households in the United States with a correlation coefficient (R) of 0.479 and weighted average of 67.7%, a difference of 4.4%.
Family Households Correlation Summary
| Measurement | Choctaw | Cuban |
| Minimum | 43.9% | 46.6% |
| Maximum | 100.0% | 100.0% |
| Range | 56.1% | 53.4% |
| Mean | 66.7% | 70.2% |
| Median | 65.7% | 70.5% |
| Interquartile 25% (IQ1) | 62.6% | 64.3% |
| Interquartile 75% (IQ3) | 68.1% | 76.6% |
| Interquartile Range (IQR) | 5.5% | 12.3% |
| Standard Deviation (Sample) | 8.8% | 9.0% |
| Standard Deviation (Population) | 8.7% | 9.0% |
Similar Demographics by Family Households
Demographics Similar to Choctaw by Family Households
In terms of family households, the demographic groups most similar to Choctaw are Hmong (64.9%, a difference of 0.0%), Immigrants from Argentina (64.9%, a difference of 0.030%), Immigrants from Belize (64.9%, a difference of 0.030%), Hungarian (64.9%, a difference of 0.040%), and Immigrants from Oceania (64.9%, a difference of 0.050%).
| Demographics | Rating | Rank | Family Households |
| Immigrants | Iraq | 95.4 /100 | #116 | Exceptional 65.0% |
| Cherokee | 95.3 /100 | #117 | Exceptional 65.0% |
| Dutch | 95.1 /100 | #118 | Exceptional 64.9% |
| Immigrants | Eastern Asia | 94.4 /100 | #119 | Exceptional 64.9% |
| Immigrants | Oceania | 94.2 /100 | #120 | Exceptional 64.9% |
| Hungarians | 94.0 /100 | #121 | Exceptional 64.9% |
| Hmong | 93.4 /100 | #122 | Exceptional 64.9% |
| Choctaw | 93.4 /100 | #123 | Exceptional 64.9% |
| Immigrants | Argentina | 92.8 /100 | #124 | Exceptional 64.9% |
| Immigrants | Belize | 92.7 /100 | #125 | Exceptional 64.9% |
| Panamanians | 92.4 /100 | #126 | Exceptional 64.8% |
| Immigrants | Panama | 92.0 /100 | #127 | Exceptional 64.8% |
| Italians | 91.9 /100 | #128 | Exceptional 64.8% |
| Immigrants | Ecuador | 91.4 /100 | #129 | Exceptional 64.8% |
| Immigrants | Italy | 90.2 /100 | #130 | Exceptional 64.8% |
Demographics Similar to Cubans by Family Households
In terms of family households, the demographic groups most similar to Cubans are Sri Lankan (67.7%, a difference of 0.040%), Inupiat (67.8%, a difference of 0.050%), Immigrants from Pakistan (67.7%, a difference of 0.12%), Samoan (67.9%, a difference of 0.30%), and Immigrants from South Eastern Asia (67.5%, a difference of 0.41%).
| Demographics | Rating | Rank | Family Households |
| Immigrants | Cuba | 100.0 /100 | #14 | Exceptional 68.2% |
| Assyrians/Chaldeans/Syriacs | 100.0 /100 | #15 | Exceptional 68.2% |
| Immigrants | Vietnam | 100.0 /100 | #16 | Exceptional 68.2% |
| Chinese | 100.0 /100 | #17 | Exceptional 68.1% |
| Immigrants | Taiwan | 100.0 /100 | #18 | Exceptional 68.0% |
| Samoans | 100.0 /100 | #19 | Exceptional 67.9% |
| Inupiat | 100.0 /100 | #20 | Exceptional 67.8% |
| Cubans | 100.0 /100 | #21 | Exceptional 67.7% |
| Sri Lankans | 100.0 /100 | #22 | Exceptional 67.7% |
| Immigrants | Pakistan | 100.0 /100 | #23 | Exceptional 67.7% |
| Immigrants | South Eastern Asia | 100.0 /100 | #24 | Exceptional 67.5% |
| Immigrants | Nicaragua | 100.0 /100 | #25 | Exceptional 67.5% |
| Immigrants | India | 100.0 /100 | #26 | Exceptional 67.4% |
| Hispanics or Latinos | 100.0 /100 | #27 | Exceptional 67.4% |
| Hawaiians | 100.0 /100 | #28 | Exceptional 67.4% |