Chinese vs Immigrants from the Azores Married-couple Households
COMPARE
Chinese
Immigrants from the Azores
Married-couple Households
Married-couple Households Comparison
Chinese
Immigrants from the Azores
50.4%
MARRIED-COUPLE HOUSEHOLDS
100.0/ 100
METRIC RATING
10th/ 347
METRIC RANK
45.2%
MARRIED-COUPLE HOUSEHOLDS
5.3/ 100
METRIC RATING
218th/ 347
METRIC RANK
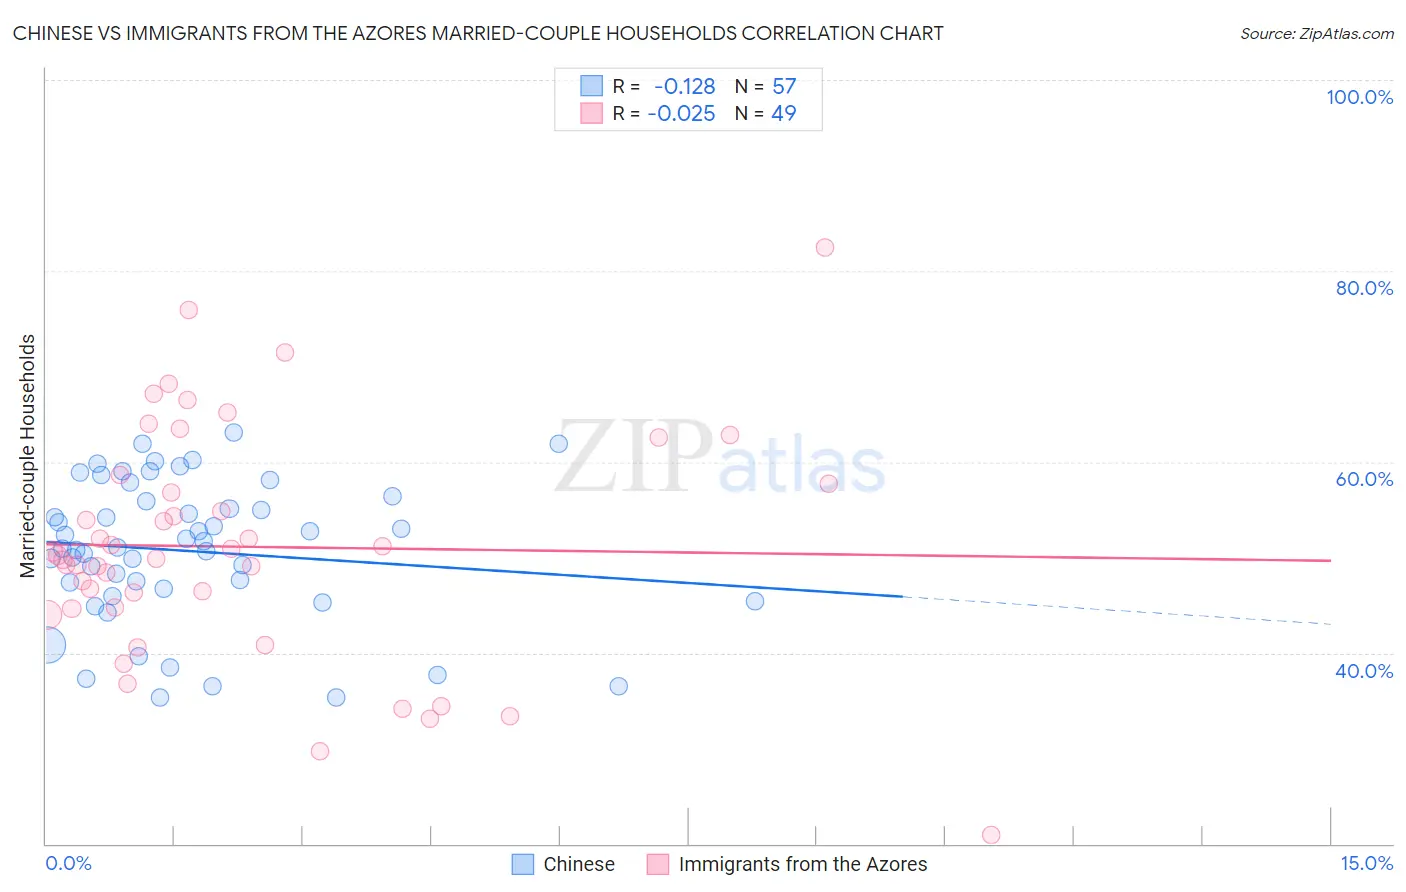
Chinese vs Immigrants from the Azores Married-couple Households Correlation Chart
The statistical analysis conducted on geographies consisting of 64,801,742 people shows a poor negative correlation between the proportion of Chinese and percentage of married-couple family households in the United States with a correlation coefficient (R) of -0.128 and weighted average of 50.4%. Similarly, the statistical analysis conducted on geographies consisting of 46,257,310 people shows no correlation between the proportion of Immigrants from the Azores and percentage of married-couple family households in the United States with a correlation coefficient (R) of -0.025 and weighted average of 45.2%, a difference of 11.4%.
Married-couple Households Correlation Summary
| Measurement | Chinese | Immigrants from the Azores |
| Minimum | 35.3% | 21.0% |
| Maximum | 63.0% | 82.5% |
| Range | 27.8% | 61.5% |
| Mean | 50.6% | 51.1% |
| Median | 51.0% | 50.2% |
| Interquartile 25% (IQ1) | 46.3% | 44.7% |
| Interquartile 75% (IQ3) | 56.2% | 58.1% |
| Interquartile Range (IQR) | 9.9% | 13.4% |
| Standard Deviation (Sample) | 7.4% | 12.2% |
| Standard Deviation (Population) | 7.4% | 12.1% |
Similar Demographics by Married-couple Households
Demographics Similar to Chinese by Married-couple Households
In terms of married-couple households, the demographic groups most similar to Chinese are Pennsylvania German (50.4%, a difference of 0.0%), Immigrants from Pakistan (50.1%, a difference of 0.44%), Immigrants from South Central Asia (50.6%, a difference of 0.55%), Swiss (49.9%, a difference of 0.81%), and Immigrants from Korea (49.9%, a difference of 0.98%).
| Demographics | Rating | Rank | Married-couple Households |
| Thais | 100.0 /100 | #3 | Exceptional 51.9% |
| Assyrians/Chaldeans/Syriacs | 100.0 /100 | #4 | Exceptional 51.8% |
| Tongans | 100.0 /100 | #5 | Exceptional 51.6% |
| Danes | 100.0 /100 | #6 | Exceptional 51.1% |
| Filipinos | 100.0 /100 | #7 | Exceptional 51.0% |
| Immigrants | South Central Asia | 100.0 /100 | #8 | Exceptional 50.6% |
| Pennsylvania Germans | 100.0 /100 | #9 | Exceptional 50.4% |
| Chinese | 100.0 /100 | #10 | Exceptional 50.4% |
| Immigrants | Pakistan | 100.0 /100 | #11 | Exceptional 50.1% |
| Swiss | 100.0 /100 | #12 | Exceptional 49.9% |
| Immigrants | Korea | 100.0 /100 | #13 | Exceptional 49.9% |
| Burmese | 100.0 /100 | #14 | Exceptional 49.8% |
| Koreans | 99.9 /100 | #15 | Exceptional 49.7% |
| Swedes | 99.9 /100 | #16 | Exceptional 49.7% |
| Immigrants | Hong Kong | 99.9 /100 | #17 | Exceptional 49.6% |
Demographics Similar to Immigrants from the Azores by Married-couple Households
In terms of married-couple households, the demographic groups most similar to Immigrants from the Azores are Nicaraguan (45.2%, a difference of 0.010%), Panamanian (45.2%, a difference of 0.030%), Immigrants from Thailand (45.2%, a difference of 0.040%), Immigrants from Nepal (45.2%, a difference of 0.050%), and Immigrants from Portugal (45.2%, a difference of 0.050%).
| Demographics | Rating | Rank | Married-couple Households |
| Immigrants | Spain | 7.3 /100 | #211 | Tragic 45.3% |
| Creek | 6.4 /100 | #212 | Tragic 45.3% |
| Yakama | 5.8 /100 | #213 | Tragic 45.2% |
| Japanese | 5.7 /100 | #214 | Tragic 45.2% |
| Immigrants | Nepal | 5.6 /100 | #215 | Tragic 45.2% |
| Immigrants | Portugal | 5.6 /100 | #216 | Tragic 45.2% |
| Panamanians | 5.5 /100 | #217 | Tragic 45.2% |
| Immigrants | Azores | 5.3 /100 | #218 | Tragic 45.2% |
| Nicaraguans | 5.3 /100 | #219 | Tragic 45.2% |
| Immigrants | Thailand | 5.1 /100 | #220 | Tragic 45.2% |
| Tlingit-Haida | 4.9 /100 | #221 | Tragic 45.1% |
| Immigrants | Laos | 4.6 /100 | #222 | Tragic 45.1% |
| Immigrants | Cambodia | 2.7 /100 | #223 | Tragic 44.9% |
| Immigrants | Micronesia | 2.6 /100 | #224 | Tragic 44.9% |
| Dutch West Indians | 2.6 /100 | #225 | Tragic 44.9% |