Chickasaw vs Iraqi Divorced or Separated
COMPARE
Chickasaw
Iraqi
Divorced or Separated
Divorced or Separated Comparison
Chickasaw
Iraqis
14.2%
DIVORCED OR SEPARATED
0.0/ 100
METRIC RATING
340th/ 347
METRIC RANK
11.8%
DIVORCED OR SEPARATED
94.6/ 100
METRIC RATING
120th/ 347
METRIC RANK
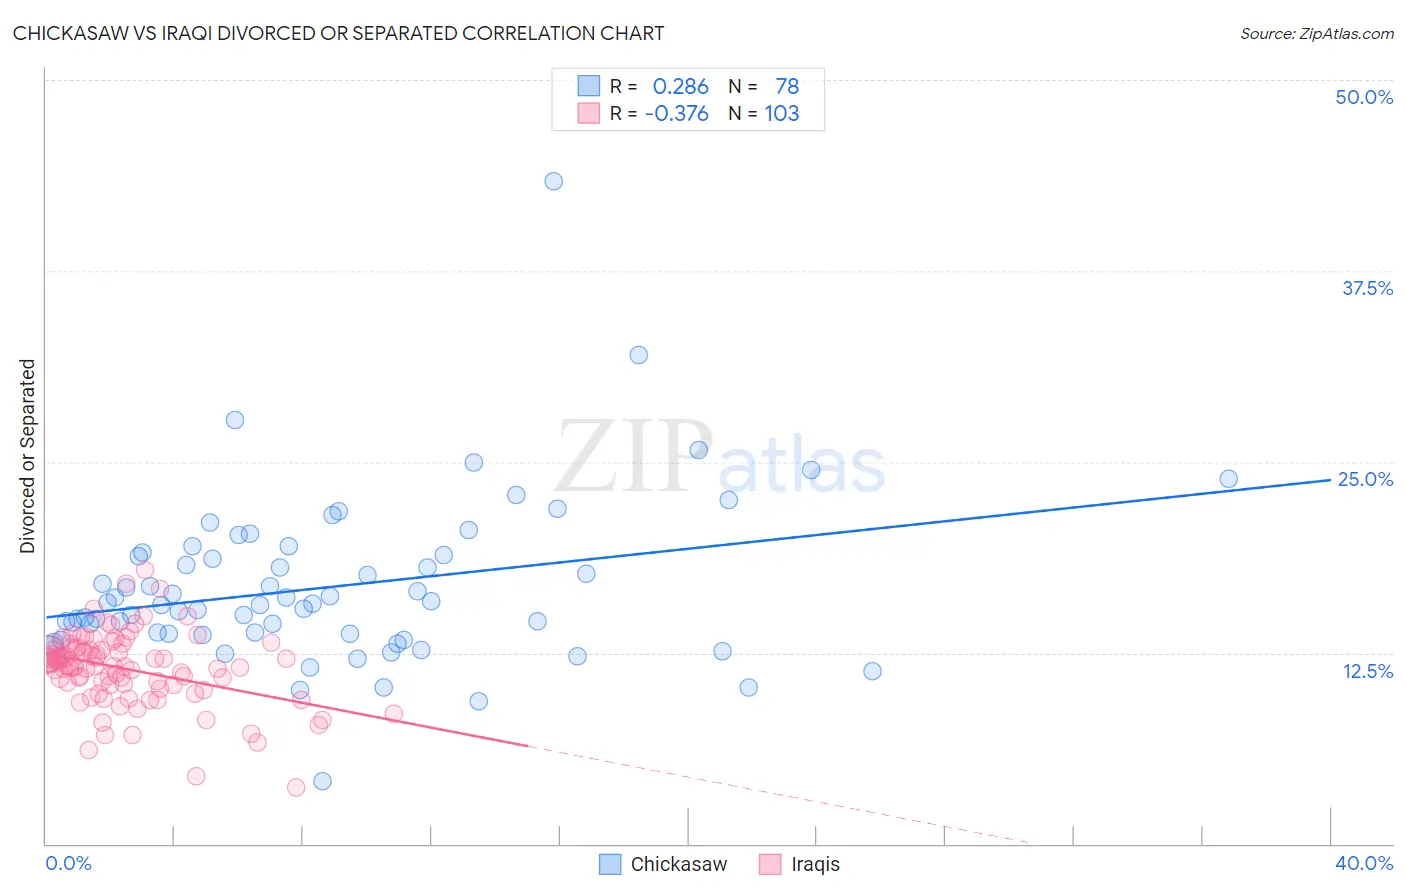
Chickasaw vs Iraqi Divorced or Separated Correlation Chart
The statistical analysis conducted on geographies consisting of 147,714,015 people shows a weak positive correlation between the proportion of Chickasaw and percentage of population currently divorced or separated in the United States with a correlation coefficient (R) of 0.286 and weighted average of 14.2%. Similarly, the statistical analysis conducted on geographies consisting of 170,608,468 people shows a mild negative correlation between the proportion of Iraqis and percentage of population currently divorced or separated in the United States with a correlation coefficient (R) of -0.376 and weighted average of 11.8%, a difference of 20.8%.
Divorced or Separated Correlation Summary
| Measurement | Chickasaw | Iraqi |
| Minimum | 4.1% | 3.7% |
| Maximum | 43.4% | 17.9% |
| Range | 39.3% | 14.2% |
| Mean | 16.8% | 11.4% |
| Median | 15.7% | 11.7% |
| Interquartile 25% (IQ1) | 13.8% | 10.4% |
| Interquartile 75% (IQ3) | 18.9% | 12.7% |
| Interquartile Range (IQR) | 5.1% | 2.4% |
| Standard Deviation (Sample) | 5.4% | 2.4% |
| Standard Deviation (Population) | 5.4% | 2.4% |
Similar Demographics by Divorced or Separated
Demographics Similar to Chickasaw by Divorced or Separated
In terms of divorced or separated, the demographic groups most similar to Chickasaw are Colville (14.2%, a difference of 0.040%), Bahamian (14.2%, a difference of 0.20%), Seminole (14.3%, a difference of 0.36%), Choctaw (14.1%, a difference of 0.57%), and Crow (14.1%, a difference of 0.88%).
| Demographics | Rating | Rank | Divorced or Separated |
| Puerto Ricans | 0.0 /100 | #333 | Tragic 13.9% |
| Immigrants | Bahamas | 0.0 /100 | #334 | Tragic 13.9% |
| Dutch West Indians | 0.0 /100 | #335 | Tragic 14.0% |
| Shoshone | 0.0 /100 | #336 | Tragic 14.0% |
| Crow | 0.0 /100 | #337 | Tragic 14.1% |
| Choctaw | 0.0 /100 | #338 | Tragic 14.1% |
| Colville | 0.0 /100 | #339 | Tragic 14.2% |
| Chickasaw | 0.0 /100 | #340 | Tragic 14.2% |
| Bahamians | 0.0 /100 | #341 | Tragic 14.2% |
| Seminole | 0.0 /100 | #342 | Tragic 14.3% |
| Creek | 0.0 /100 | #343 | Tragic 14.4% |
| Cubans | 0.0 /100 | #344 | Tragic 14.5% |
| Kiowa | 0.0 /100 | #345 | Tragic 14.5% |
| Arapaho | 0.0 /100 | #346 | Tragic 14.8% |
| Immigrants | Cuba | 0.0 /100 | #347 | Tragic 15.2% |
Demographics Similar to Iraqis by Divorced or Separated
In terms of divorced or separated, the demographic groups most similar to Iraqis are Romanian (11.8%, a difference of 0.010%), Syrian (11.7%, a difference of 0.090%), Immigrants from Uganda (11.7%, a difference of 0.13%), Ecuadorian (11.7%, a difference of 0.13%), and Menominee (11.8%, a difference of 0.13%).
| Demographics | Rating | Rank | Divorced or Separated |
| Estonians | 96.6 /100 | #113 | Exceptional 11.7% |
| Immigrants | Norway | 95.9 /100 | #114 | Exceptional 11.7% |
| Lithuanians | 95.7 /100 | #115 | Exceptional 11.7% |
| Immigrants | Iraq | 95.4 /100 | #116 | Exceptional 11.7% |
| Immigrants | Uganda | 95.3 /100 | #117 | Exceptional 11.7% |
| Ecuadorians | 95.3 /100 | #118 | Exceptional 11.7% |
| Syrians | 95.1 /100 | #119 | Exceptional 11.7% |
| Iraqis | 94.6 /100 | #120 | Exceptional 11.8% |
| Romanians | 94.5 /100 | #121 | Exceptional 11.8% |
| Menominee | 93.8 /100 | #122 | Exceptional 11.8% |
| Immigrants | Immigrants | 93.7 /100 | #123 | Exceptional 11.8% |
| Ugandans | 93.1 /100 | #124 | Exceptional 11.8% |
| Ukrainians | 92.3 /100 | #125 | Exceptional 11.8% |
| South American Indians | 92.1 /100 | #126 | Exceptional 11.8% |
| South Africans | 88.9 /100 | #127 | Excellent 11.8% |