Celtic vs Polish Married-couple Households
COMPARE
Celtic
Polish
Married-couple Households
Married-couple Households Comparison
Celtics
Poles
47.3%
MARRIED-COUPLE HOUSEHOLDS
88.1/ 100
METRIC RATING
127th/ 347
METRIC RANK
48.5%
MARRIED-COUPLE HOUSEHOLDS
99.2/ 100
METRIC RATING
57th/ 347
METRIC RANK
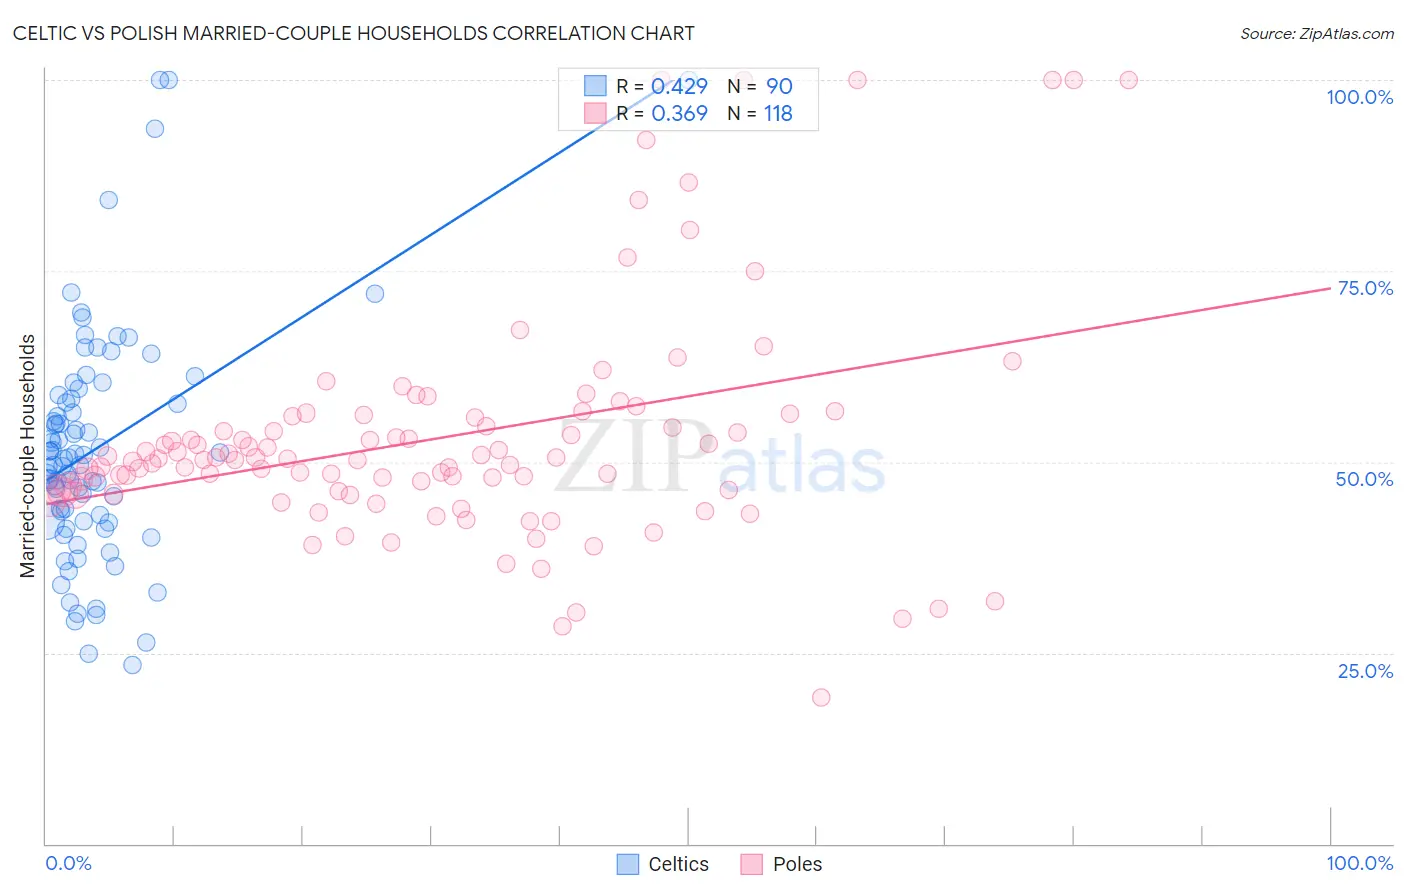
Celtic vs Polish Married-couple Households Correlation Chart
The statistical analysis conducted on geographies consisting of 168,846,519 people shows a moderate positive correlation between the proportion of Celtics and percentage of married-couple family households in the United States with a correlation coefficient (R) of 0.429 and weighted average of 47.3%. Similarly, the statistical analysis conducted on geographies consisting of 559,940,539 people shows a mild positive correlation between the proportion of Poles and percentage of married-couple family households in the United States with a correlation coefficient (R) of 0.369 and weighted average of 48.5%, a difference of 2.6%.
Married-couple Households Correlation Summary
| Measurement | Celtic | Polish |
| Minimum | 23.4% | 19.1% |
| Maximum | 100.0% | 100.0% |
| Range | 76.6% | 80.9% |
| Mean | 51.8% | 53.2% |
| Median | 50.4% | 50.3% |
| Interquartile 25% (IQ1) | 42.3% | 46.2% |
| Interquartile 75% (IQ3) | 58.3% | 56.0% |
| Interquartile Range (IQR) | 16.1% | 9.8% |
| Standard Deviation (Sample) | 15.3% | 15.2% |
| Standard Deviation (Population) | 15.3% | 15.1% |
Similar Demographics by Married-couple Households
Demographics Similar to Celtics by Married-couple Households
In terms of married-couple households, the demographic groups most similar to Celtics are Immigrants from Peru (47.3%, a difference of 0.020%), Immigrants from Iraq (47.3%, a difference of 0.030%), Immigrants from Hungary (47.3%, a difference of 0.030%), Pakistani (47.3%, a difference of 0.040%), and Immigrants from Denmark (47.3%, a difference of 0.050%).
| Demographics | Rating | Rank | Married-couple Households |
| Puget Sound Salish | 90.5 /100 | #120 | Exceptional 47.4% |
| Immigrants | Eastern Europe | 90.3 /100 | #121 | Exceptional 47.4% |
| Okinawans | 90.1 /100 | #122 | Exceptional 47.4% |
| Immigrants | Venezuela | 89.3 /100 | #123 | Excellent 47.4% |
| Zimbabweans | 89.2 /100 | #124 | Excellent 47.4% |
| Australians | 89.0 /100 | #125 | Excellent 47.4% |
| Pakistanis | 88.6 /100 | #126 | Excellent 47.3% |
| Celtics | 88.1 /100 | #127 | Excellent 47.3% |
| Immigrants | Peru | 87.9 /100 | #128 | Excellent 47.3% |
| Immigrants | Iraq | 87.8 /100 | #129 | Excellent 47.3% |
| Immigrants | Hungary | 87.8 /100 | #130 | Excellent 47.3% |
| Immigrants | Denmark | 87.5 /100 | #131 | Excellent 47.3% |
| Immigrants | Ukraine | 86.7 /100 | #132 | Excellent 47.3% |
| South Africans | 86.4 /100 | #133 | Excellent 47.3% |
| Immigrants | Greece | 86.0 /100 | #134 | Excellent 47.2% |
Demographics Similar to Poles by Married-couple Households
In terms of married-couple households, the demographic groups most similar to Poles are Immigrants from Indonesia (48.5%, a difference of 0.0%), Czechoslovakian (48.5%, a difference of 0.010%), Croatian (48.5%, a difference of 0.080%), Immigrants from Lithuania (48.6%, a difference of 0.090%), and Austrian (48.6%, a difference of 0.090%).
| Demographics | Rating | Rank | Married-couple Households |
| Samoans | 99.4 /100 | #50 | Exceptional 48.7% |
| Eastern Europeans | 99.3 /100 | #51 | Exceptional 48.6% |
| Irish | 99.3 /100 | #52 | Exceptional 48.6% |
| Whites/Caucasians | 99.3 /100 | #53 | Exceptional 48.6% |
| Immigrants | Lithuania | 99.3 /100 | #54 | Exceptional 48.6% |
| Austrians | 99.3 /100 | #55 | Exceptional 48.6% |
| Immigrants | Northern Europe | 99.3 /100 | #56 | Exceptional 48.6% |
| Poles | 99.2 /100 | #57 | Exceptional 48.5% |
| Immigrants | Indonesia | 99.2 /100 | #58 | Exceptional 48.5% |
| Czechoslovakians | 99.2 /100 | #59 | Exceptional 48.5% |
| Croatians | 99.1 /100 | #60 | Exceptional 48.5% |
| Bulgarians | 99.1 /100 | #61 | Exceptional 48.5% |
| Luxembourgers | 99.1 /100 | #62 | Exceptional 48.5% |
| Basques | 99.0 /100 | #63 | Exceptional 48.4% |
| Northern Europeans | 99.0 /100 | #64 | Exceptional 48.4% |