Bhutanese vs Ute Married-couple Households

COMPARE

Bhutanese
Race
Ancestry
AfghanAfricanAlaska NativeAlaskan AthabascanAlbanianAleutAlsatianAmericanApacheArabArapahoArgentineanArmenianAssyrian/Chaldean/SyriacAustralianAustrianBahamianBangladeshiBarbadianBasqueBelgianBelizeanBermudanBhutaneseBlackfeetBolivianBrazilianBritishBritish West IndianBulgarianBurmeseCajunCambodianCanadianCape VerdeanCarpatho RusynCelticCentral AmericanCentral American IndianCherokeeCheyenneChickasawChileanChineseChippewaChoctawColombianColvilleComancheCosta RicanCreeCreekCroatianCrowCubanCypriotCzechCzechoslovakianDanishDelawareDominicanDutchDutch West IndianEastern EuropeanEcuadorianEgyptianEnglishEstonianEthiopianEuropeanFijianFilipinoFinnishFrenchFrench American IndianFrench CanadianGermanGerman RussianGhanaianGreekGuamanian/ChamorroGuatemalanGuyaneseHaitianHmongHonduranHopiHoumaHungarianIcelanderIndian (Asian)IndonesianInupiatIranianIraqiIrishIroquoisIsraeliItalianJamaicanJapaneseJordanianKenyanKiowaKoreanLaotianLatvianLebaneseLiberianLithuanianLumbeeLuxembourgerMacedonianMalaysianMalteseMarshalleseMenomineeMexicanMexican American IndianMongolianMoroccanNative HawaiianNavajoNepaleseNew ZealanderNicaraguanNigerianNorthern EuropeanNorwegianOkinawanOsageOttawaPaiutePakistaniPalestinianPanamanianParaguayanPennsylvania GermanPeruvianPimaPolishPortuguesePotawatomiPuebloPuerto RicanPuget Sound SalishRomanianRussianSalvadoranSamoanScandinavianScotch-IrishScottishSeminoleSenegaleseSerbianShoshoneSierra LeoneanSiouxSlavicSlovakSloveneSomaliSouth AfricanSouth AmericanSouth American IndianSoviet UnionSpaniardSpanishSpanish AmericanSpanish American IndianSri LankanSubsaharan AfricanSudaneseSwedishSwissSyrianTaiwaneseThaiTlingit-HaidaTohono O'OdhamTonganTrinidadian and TobagonianTsimshianTurkishU.S. Virgin IslanderUgandanUkrainianUruguayanVenezuelanVietnameseWelshWest IndianYakamaYaquiYugoslavianYumanYup'ikZimbabwean
Immigration
NonimmigrantsImmigrantsAfghanistanAfricaAlbaniaArgentinaArmeniaAsiaAustraliaAustriaBahamasBangladeshBarbadosBelarusBelgiumBelizeBoliviaBosnia and HerzegovinaBrazilBulgariaBurma/MyanmarCabo VerdeCambodiaCameroonCanadaCaribbeanCentral AmericaChileChinaColombiaCongoCosta RicaCroatiaCubaCzechoslovakiaDenmarkDominicaDominican RepublicEastern AfricaEastern AsiaEastern EuropeEcuadorEgyptEl SalvadorEnglandEritreaEthiopiaEuropeFijiFranceGermanyGhanaGreeceGrenadaGuatemalaGuyanaHaitiHondurasHong KongHungaryIndiaIndonesiaIranIraqIrelandIsraelItalyJamaicaJapanJordanKazakhstanKenyaKoreaKuwaitLaosLatin AmericaLatviaLebanonLiberiaLithuaniaMalaysiaMexicoMicronesiaMiddle AfricaMoldovaMoroccoNepalNetherlandsNicaraguaNigeriaNorth AmericaNorth MacedoniaNorthern AfricaNorthern EuropeNorwayOceaniaPakistanPanamaPeruPhilippinesPolandPortugalRomaniaRussiaSaudi ArabiaScotlandSenegalSerbiaSierra LeoneSingaporeSomaliaSouth AfricaSouth AmericaSouth Central AsiaSouth Eastern AsiaSouthern EuropeSpainSri LankaSt. Vincent and the GrenadinesSudanSwedenSwitzerlandSyriaTaiwanThailandTrinidad and TobagoTurkeyUgandaUkraineUruguayUzbekistanVenezuelaVietnamWest IndiesWestern AfricaWestern AsiaWestern EuropeYemenZaireZimbabweAzores
Ute
Race
Ancestry
AfghanAfricanAlaska NativeAlaskan AthabascanAlbanianAleutAlsatianAmericanApacheArabArapahoArgentineanArmenianAssyrian/Chaldean/SyriacAustralianAustrianBahamianBangladeshiBarbadianBasqueBelgianBelizeanBermudanBlackfeetBolivianBrazilianBritishBritish West IndianBulgarianBurmeseCajunCambodianCanadianCape VerdeanCarpatho RusynCelticCentral AmericanCentral American IndianCherokeeCheyenneChickasawChileanChineseChippewaChoctawColombianColvilleComancheCosta RicanCreeCreekCroatianCrowCubanCypriotCzechCzechoslovakianDanishDelawareDominicanDutchDutch West IndianEastern EuropeanEcuadorianEgyptianEnglishEstonianEthiopianEuropeanFijianFilipinoFinnishFrenchFrench American IndianFrench CanadianGermanGerman RussianGhanaianGreekGuamanian/ChamorroGuatemalanGuyaneseHaitianHmongHonduranHopiHoumaHungarianIcelanderIndian (Asian)IndonesianInupiatIranianIraqiIrishIroquoisIsraeliItalianJamaicanJapaneseJordanianKenyanKiowaKoreanLaotianLatvianLebaneseLiberianLithuanianLumbeeLuxembourgerMacedonianMalaysianMalteseMarshalleseMenomineeMexicanMexican American IndianMongolianMoroccanNative HawaiianNavajoNepaleseNew ZealanderNicaraguanNigerianNorthern EuropeanNorwegianOkinawanOsageOttawaPaiutePakistaniPalestinianPanamanianParaguayanPennsylvania GermanPeruvianPimaPolishPortuguesePotawatomiPuebloPuerto RicanPuget Sound SalishRomanianRussianSalvadoranSamoanScandinavianScotch-IrishScottishSeminoleSenegaleseSerbianShoshoneSierra LeoneanSiouxSlavicSlovakSloveneSomaliSouth AfricanSouth AmericanSouth American IndianSoviet UnionSpaniardSpanishSpanish AmericanSpanish American IndianSri LankanSubsaharan AfricanSudaneseSwedishSwissSyrianTaiwaneseThaiTlingit-HaidaTohono O'OdhamTonganTrinidadian and TobagonianTsimshianTurkishU.S. Virgin IslanderUgandanUkrainianUruguayanUteVenezuelanVietnameseWelshWest IndianYakamaYaquiYugoslavianYumanYup'ikZimbabwean
Immigration
NonimmigrantsImmigrantsAfghanistanAfricaAlbaniaArgentinaArmeniaAsiaAustraliaAustriaBahamasBangladeshBarbadosBelarusBelgiumBelizeBoliviaBosnia and HerzegovinaBrazilBulgariaBurma/MyanmarCabo VerdeCambodiaCameroonCanadaCaribbeanCentral AmericaChileChinaColombiaCongoCosta RicaCroatiaCubaCzechoslovakiaDenmarkDominicaDominican RepublicEastern AfricaEastern AsiaEastern EuropeEcuadorEgyptEl SalvadorEnglandEritreaEthiopiaEuropeFijiFranceGermanyGhanaGreeceGrenadaGuatemalaGuyanaHaitiHondurasHong KongHungaryIndiaIndonesiaIranIraqIrelandIsraelItalyJamaicaJapanJordanKazakhstanKenyaKoreaKuwaitLaosLatin AmericaLatviaLebanonLiberiaLithuaniaMalaysiaMexicoMicronesiaMiddle AfricaMoldovaMoroccoNepalNetherlandsNicaraguaNigeriaNorth AmericaNorth MacedoniaNorthern AfricaNorthern EuropeNorwayOceaniaPakistanPanamaPeruPhilippinesPolandPortugalRomaniaRussiaSaudi ArabiaScotlandSenegalSerbiaSierra LeoneSingaporeSomaliaSouth AfricaSouth AmericaSouth Central AsiaSouth Eastern AsiaSouthern EuropeSpainSri LankaSt. Vincent and the GrenadinesSudanSwedenSwitzerlandSyriaTaiwanThailandTrinidad and TobagoTurkeyUgandaUkraineUruguayUzbekistanVenezuelaVietnamWest IndiesWestern AfricaWestern AsiaWestern EuropeYemenZaireZimbabweAzores
Married-couple Households
Income
Poverty
Unemployment
Labor Participation
Family Structure
Vehicle Availability
Education Level
Disability

Married-couple Households Comparison

Bhutanese

Ute

Exceptional
Tragic
49.3%
MARRIED-COUPLE HOUSEHOLDS
99.8/ 100
METRIC RATING
27th/ 347
METRIC RANK
44.4%
MARRIED-COUPLE HOUSEHOLDS
1.0/ 100
METRIC RATING
240th/ 347
METRIC RANK

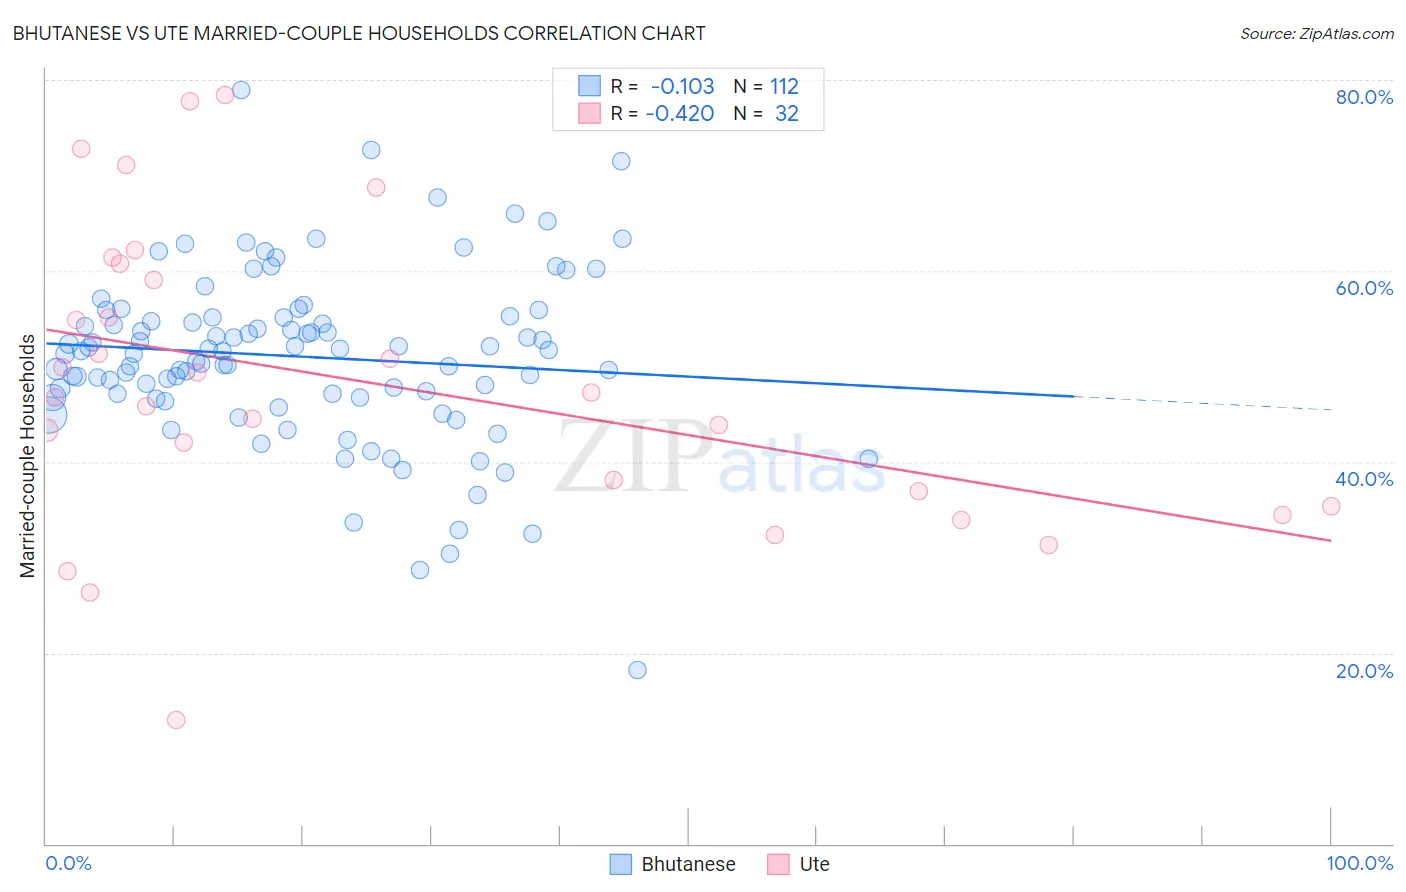
Bhutanese vs Ute Married-couple Households Correlation Chart

The statistical analysis conducted on geographies consisting of 455,135,047 people shows a poor negative correlation between the proportion of Bhutanese and percentage of married-couple family households in the United States with a correlation coefficient (R) of -0.103 and weighted average of 49.3%. Similarly, the statistical analysis conducted on geographies consisting of 55,658,636 people shows a moderate negative correlation between the proportion of Ute and percentage of married-couple family households in the United States with a correlation coefficient (R) of -0.420 and weighted average of 44.4%, a difference of 10.8%.
Bhutanese vs Ute Married-couple Households

Married-couple Households Correlation Summary

MeasurementBhutaneseUte
Minimum18.2%12.9%
Maximum78.9%78.5%
Range60.7%65.6%
Mean51.0%48.4%
Median51.5%47.0%
Interquartile 25% (IQ1)47.0%36.1%
Interquartile 75% (IQ3)55.1%59.9%
Interquartile Range (IQR)8.1%23.8%
Standard Deviation (Sample)9.0%15.7%
Standard Deviation (Population)9.0%15.5%

Similar Demographics by Married-couple Households

Demographics Similar to Bhutanese by Married-couple Households

In terms of married-couple households, the demographic groups most similar to Bhutanese are Immigrants from Scotland (49.3%, a difference of 0.020%), Immigrants from Philippines (49.3%, a difference of 0.15%), German (49.2%, a difference of 0.19%), Maltese (49.2%, a difference of 0.20%), and Bolivian (49.2%, a difference of 0.21%).
DemographicsRating | RankMarried-couple Households
Scandinavians
99.9
/100
|
#20
Exceptional
49.6%
Norwegians
99.9
/100
|
#21
Exceptional
49.5%
Asians
99.9
/100
|
#22
Exceptional
49.5%
Dutch
99.9
/100
|
#23
Exceptional
49.5%
Czechs
99.9
/100
|
#24
Exceptional
49.4%
Immigrants | Philippines
99.9
/100
|
#25
Exceptional
49.3%
Immigrants | Scotland
99.8
/100
|
#26
Exceptional
49.3%
Bhutanese
99.8
/100
|
#27
Exceptional
49.3%
Germans
99.8
/100
|
#28
Exceptional
49.2%
Maltese
99.8
/100
|
#29
Exceptional
49.2%
Bolivians
99.8
/100
|
#30
Exceptional
49.2%
Native Hawaiians
99.8
/100
|
#31
Exceptional
49.1%
Hungarians
99.8
/100
|
#32
Exceptional
49.1%
Immigrants | Asia
99.7
/100
|
#33
Exceptional
49.1%
Italians
99.7
/100
|
#34
Exceptional
49.0%

Demographics Similar to Ute by Married-couple Households

In terms of married-couple households, the demographic groups most similar to Ute are Immigrants from Bosnia and Herzegovina (44.4%, a difference of 0.0%), Immigrants from Albania (44.4%, a difference of 0.040%), Spanish American (44.5%, a difference of 0.080%), Immigrants from Uruguay (44.5%, a difference of 0.10%), and Immigrants from Saudi Arabia (44.4%, a difference of 0.11%).
DemographicsRating | RankMarried-couple Households
Immigrants | Uganda
1.5
/100
|
#233
Tragic
44.6%
Immigrants | Panama
1.3
/100
|
#234
Tragic
44.6%
Immigrants | Nicaragua
1.2
/100
|
#235
Tragic
44.5%
Yaqui
1.2
/100
|
#236
Tragic
44.5%
Comanche
1.2
/100
|
#237
Tragic
44.5%
Immigrants | Uruguay
1.1
/100
|
#238
Tragic
44.5%
Spanish Americans
1.1
/100
|
#239
Tragic
44.5%
Ute
1.0
/100
|
#240
Tragic
44.4%
Immigrants | Bosnia and Herzegovina
1.0
/100
|
#241
Tragic
44.4%
Immigrants | Albania
1.0
/100
|
#242
Tragic
44.4%
Immigrants | Saudi Arabia
0.9
/100
|
#243
Tragic
44.4%
Immigrants | Armenia
0.7
/100
|
#244
Tragic
44.3%
Immigrants | El Salvador
0.7
/100
|
#245
Tragic
44.3%
Immigrants | Cuba
0.6
/100
|
#246
Tragic
44.2%
Immigrants | Morocco
0.6
/100
|
#247
Tragic
44.2%