Bermudan vs Scandinavian Births to Unmarried Women
COMPARE
Bermudan
Scandinavian
Births to Unmarried Women
Births to Unmarried Women Comparison
Bermudans
Scandinavians
35.5%
BIRTHS TO UNMARRIED WOMEN
0.6/ 100
METRIC RATING
249th/ 347
METRIC RANK
29.8%
BIRTHS TO UNMARRIED WOMEN
92.7/ 100
METRIC RATING
113th/ 347
METRIC RANK
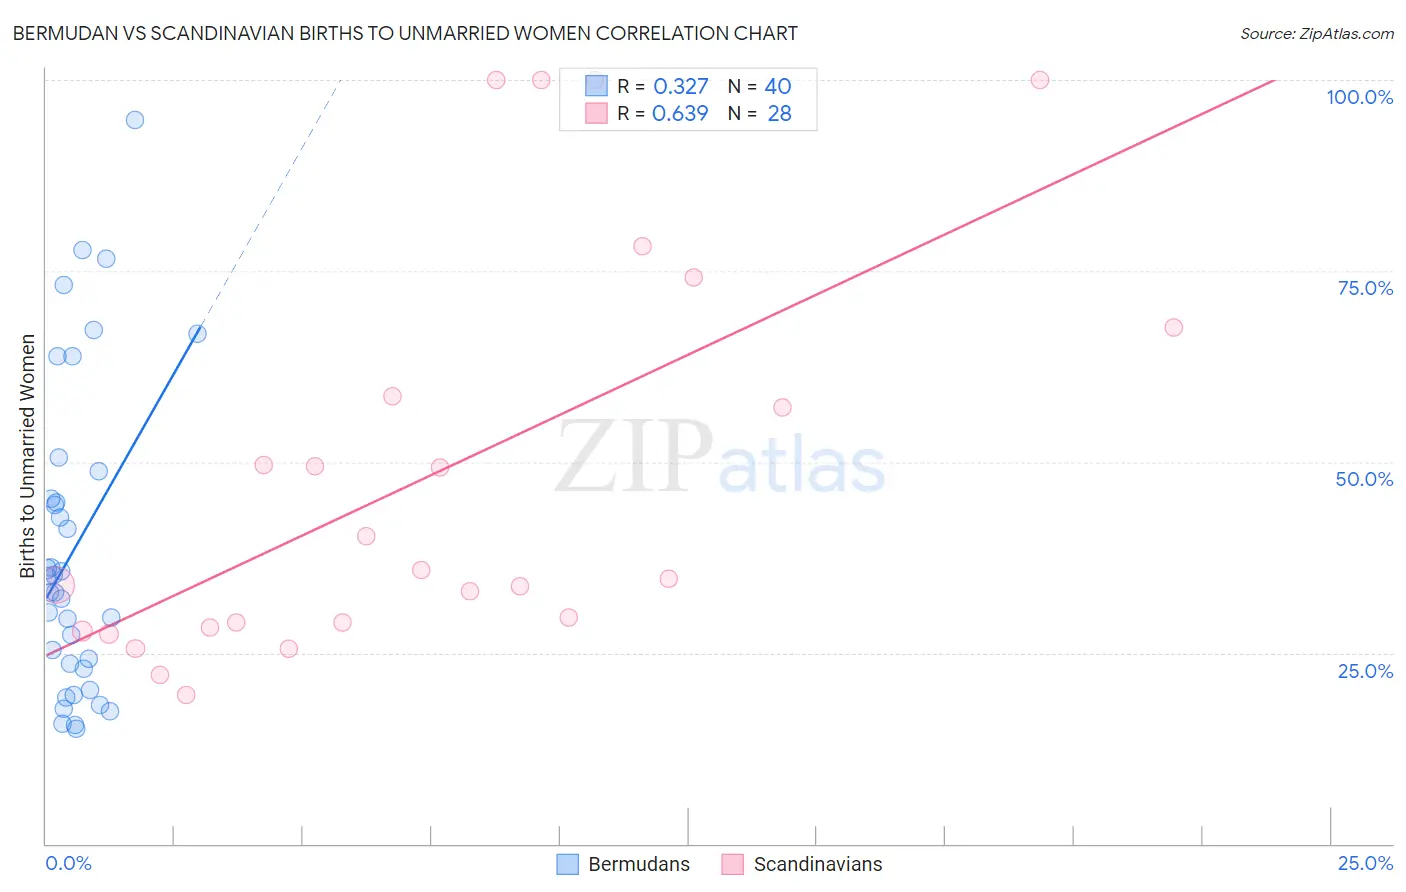
Bermudan vs Scandinavian Births to Unmarried Women Correlation Chart
The statistical analysis conducted on geographies consisting of 54,991,721 people shows a mild positive correlation between the proportion of Bermudans and percentage of births to unmarried women in the United States with a correlation coefficient (R) of 0.327 and weighted average of 35.5%. Similarly, the statistical analysis conducted on geographies consisting of 430,139,153 people shows a significant positive correlation between the proportion of Scandinavians and percentage of births to unmarried women in the United States with a correlation coefficient (R) of 0.639 and weighted average of 29.8%, a difference of 19.4%.
Births to Unmarried Women Correlation Summary
| Measurement | Bermudan | Scandinavian |
| Minimum | 15.1% | 19.6% |
| Maximum | 94.7% | 100.0% |
| Range | 79.6% | 80.4% |
| Mean | 38.7% | 48.5% |
| Median | 34.0% | 35.3% |
| Interquartile 25% (IQ1) | 23.2% | 28.6% |
| Interquartile 75% (IQ3) | 46.9% | 63.0% |
| Interquartile Range (IQR) | 23.7% | 34.4% |
| Standard Deviation (Sample) | 20.2% | 26.4% |
| Standard Deviation (Population) | 20.0% | 25.9% |
Similar Demographics by Births to Unmarried Women
Demographics Similar to Bermudans by Births to Unmarried Women
In terms of births to unmarried women, the demographic groups most similar to Bermudans are Nonimmigrants (35.5%, a difference of 0.010%), Immigrants from Nigeria (35.4%, a difference of 0.34%), Nigerian (35.3%, a difference of 0.55%), Mexican American Indian (35.7%, a difference of 0.61%), and Shoshone (35.3%, a difference of 0.66%).
| Demographics | Rating | Rank | Births to Unmarried Women |
| Indonesians | 1.2 /100 | #242 | Tragic 35.0% |
| Japanese | 0.9 /100 | #243 | Tragic 35.2% |
| Guyanese | 0.9 /100 | #244 | Tragic 35.2% |
| Shoshone | 0.8 /100 | #245 | Tragic 35.3% |
| Nigerians | 0.7 /100 | #246 | Tragic 35.3% |
| Immigrants | Nigeria | 0.7 /100 | #247 | Tragic 35.4% |
| Immigrants | Nonimmigrants | 0.6 /100 | #248 | Tragic 35.5% |
| Bermudans | 0.6 /100 | #249 | Tragic 35.5% |
| Mexican American Indians | 0.4 /100 | #250 | Tragic 35.7% |
| Immigrants | Western Africa | 0.3 /100 | #251 | Tragic 36.0% |
| Salvadorans | 0.3 /100 | #252 | Tragic 36.0% |
| Immigrants | Portugal | 0.2 /100 | #253 | Tragic 36.2% |
| Potawatomi | 0.2 /100 | #254 | Tragic 36.2% |
| Chickasaw | 0.2 /100 | #255 | Tragic 36.3% |
| Immigrants | Trinidad and Tobago | 0.2 /100 | #256 | Tragic 36.3% |
Demographics Similar to Scandinavians by Births to Unmarried Women
In terms of births to unmarried women, the demographic groups most similar to Scandinavians are Immigrants from Croatia (29.8%, a difference of 0.060%), Basque (29.7%, a difference of 0.10%), Immigrants from Hungary (29.7%, a difference of 0.11%), Immigrants from Ethiopia (29.7%, a difference of 0.25%), and Greek (29.7%, a difference of 0.28%).
| Demographics | Rating | Rank | Births to Unmarried Women |
| Swedes | 93.8 /100 | #106 | Exceptional 29.6% |
| Immigrants | Brazil | 93.7 /100 | #107 | Exceptional 29.6% |
| Paraguayans | 93.5 /100 | #108 | Exceptional 29.7% |
| Greeks | 93.4 /100 | #109 | Exceptional 29.7% |
| Immigrants | Ethiopia | 93.4 /100 | #110 | Exceptional 29.7% |
| Immigrants | Hungary | 93.0 /100 | #111 | Exceptional 29.7% |
| Basques | 93.0 /100 | #112 | Exceptional 29.7% |
| Scandinavians | 92.7 /100 | #113 | Exceptional 29.8% |
| Immigrants | Croatia | 92.6 /100 | #114 | Exceptional 29.8% |
| Ethiopians | 91.9 /100 | #115 | Exceptional 29.8% |
| Immigrants | Italy | 91.7 /100 | #116 | Exceptional 29.9% |
| Immigrants | Netherlands | 91.1 /100 | #117 | Exceptional 29.9% |
| Immigrants | Norway | 91.0 /100 | #118 | Exceptional 29.9% |
| Argentineans | 90.5 /100 | #119 | Exceptional 30.0% |
| Ugandans | 89.2 /100 | #120 | Excellent 30.1% |